30+ Accounts Payable Statistics From Reputable Sources in 2024

He received his Masters' degree in Political Science from Middle East Technical University and currently a phD student at the same university. He has background in researching location-based platforms.

Maximizing the efficiency of accounts payable process is an important agenda for the businesses. There are so many opinions on the subject, because competence in accounts payable in areas such as automation is related to the future of companies with regards to not experiencing vendor-lock-ins, choosing the right accounts payable automation tools.
Knowing the recent trends can immunize businesses against buying outdated solutions. In this article, we will provide you data from various reliable sources. These can facilitate your decision-making processes and put you one step ahead.
Accounts payable trends
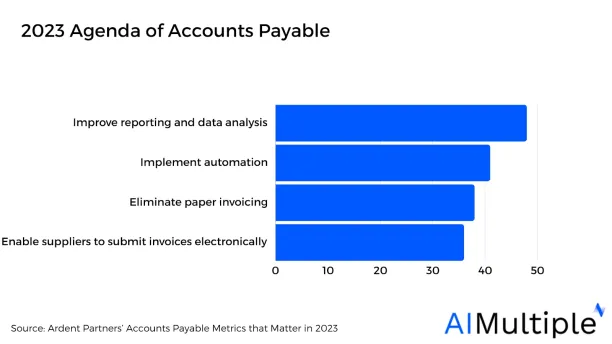
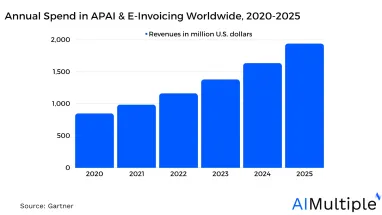
Figure 1.
Gartner predicts that by 2026, the expenditure on accounts payable automation and supplier electronic invoicing software markets is expected to reach nearly $1.75 billion, rising from around $925 million in 2021. This growth represents a compound annual growth rate (CAGR) of 14% – 1
Ardent & Partners’ survey shows that, %66 of all businesses find accounts payable (AP) essential.2
A report by Forrester indicates that solutions in SaaS and e-invoicing compliance step forward as key focus areas as they can integrate with other technologies in a relatively easier fashion.3
Top B2B payment strategies in AP were focused on paying invoices that are due and or payments are late by %59. Paying early to receive discounts followed by %32.4
Some of the top use cases AP is used in data & intelligence are as shown below in Figure 2:
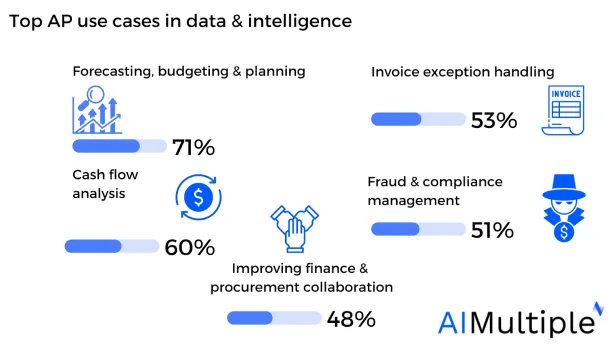
Figure 2. Source: A&P report in 2023
AP automation trends
Achieving efficient AP automation is only possible by understanding the fields where the effort is mostly put.
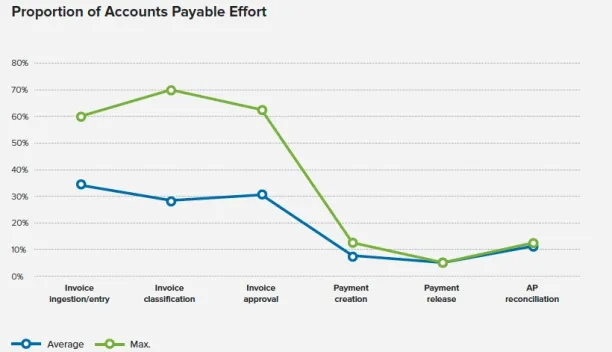
Figure 3. Source: IDC. Digitizing Accounts Payable and Receivable to Boost Efficiency and Enable Growth
The IFOL report verifies the trend shown in Figure 3. The %68 of invoice data is entered to the ERP software manually by AP teams.5
Same report also points out that AP automation takes time: %41 of respondents were not expecting to automate the process before 12 months, while %42 of them underlined that full AP automation can take 1-3 years.6
Most of the already automated processes are invoice management (%25), PO management (%17) and expense management (%17).7
AP teams valued AP automation most to reduce FTEs and increase visibility more in 2019, while in 2022 speeding up the payable processes (%24) and increasing controls (%21) steps forward.
For an overview of technology adoption in epayables, see Figure 4 below:
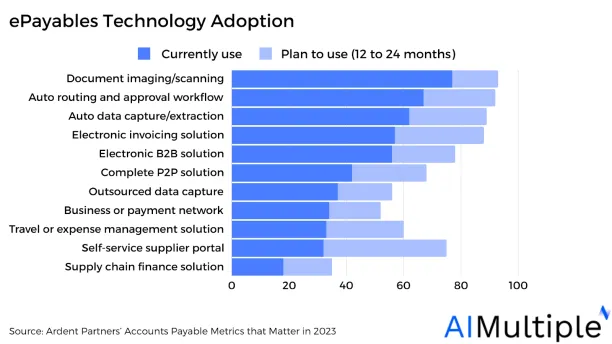
Figure 4.
For some of AP automation tools we analyzed check:
- Dynamics 365 in Accounts Payable Automation: In-Depth Review
- NetSuite Accounts Payable (AP) Automation in 2024
- Blackbaud Accounts Payable (AP) Automation in ’24: In-Depth Review
- Sage Accounts Payable (AP) Automation in ’24
- 7 Vic.AI Alternatives to Automate Accounting in 2023
- Top 10 ReadSoft Alternatives / Competitors
- Top 10 Kofax Alternatives/Competitors in 2023
- 14 Rossum AI Competitors/Alternatives in 2023
Invoice processing
According to a recent report, %48 of invoices received manually, %52 is received electronically. 8
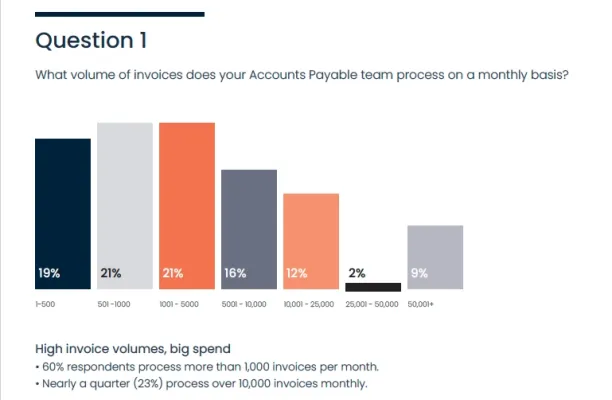
Figure 5: Source: IFOL. ACCOUNTS PAYABLE Automation Trends 2022: The Speed of Change
The average cost of invoice processing is $10 according to the same report by Ardent & Partners survey.9
From receipt to payment, an invoice is processed in an average of 10 days.10
In the IFOL report, %49 of respondents say that they use 5 days per month for invoice processing.11
Average invoice exception rate was around %22, which means 1 to 4 invoices still requires intervention by accounts payable departments.12
Around %67 of invoices are connected to POs. Attachment to POs can increase the automation rate as the matching process will be united.13
While matching to PO is important for automation, %50 of businesses in IDC’s report identify the origin of PO manually.14
The numbers in the IDC report are more remarkable: for %70 of accounts payable teams, invoice data entry is still a manual process.15
Average cost of a single supplier payment including all components was around $8 in 2023.16
The average medium-sized firm invests 0.7 FTEs to support the AP process, and %75 of medium-sized organizations receive paper or emailed invoices.17
AP challenges
AP departments spend around %22 of their time handling supplier inquiries. This can keep them from focusing on more important tasks.18
While lack of data such as PO numbers create problems for SMBs, mismatching price or quantity could also result in rejection of an invoice. See Figure 6 below:
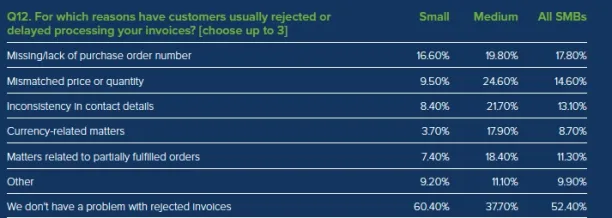
Figure 6. IDC
Ardent & Partner’s survey indicates that the biggest challenge (%47) faced in accounts payable automation is invoice/payment approvals.19
While IFOL report shows that challenges can change overtime. Biggest 2 challenges were manual data entry and paper invoices; yet today invoice exceptions and delays are also in the scene.20
The report also highlights that modifying AP processes in a flexible way and data errors still remain as top challenges. See Figure 7
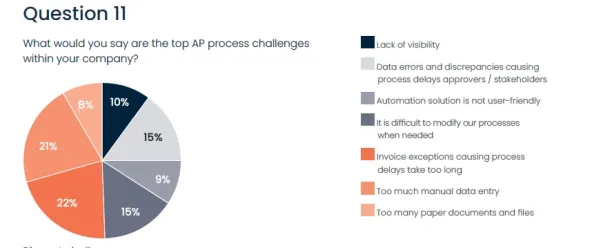
Figure 7.
Further reading
For further information on topic, you can also check:
- In-Depth Guide to Accounts Payable (AP) Automation in 2023
- Accounts Payable (AP) Automation Tools Benchmarking in 2023
- 10 AI Applications in Accounts Payable (AP) Processes for 2023
- Automated Invoice Validation: Benefits & Use Cases in 2023
- Finance Automation in ’23: What It Is, Best Tools & 6 Processes
External links:
- 1. “Market Guide for Accounts Payable Invoice AutomationSolutions”Retrieved on March 1, 2024.
- 2. “Ardent Partners’ AP Metrics that Matter in 2023”Retrieved on March 1, 2024.
- 3. “Forrester’s “The Accounts Payable Invoice Automation Landscape, Q4 2023” Report”Retrieved on March 1, 2024.
- 4. “Ardent Partners’ AP Metrics that Matter in 2023”Retrieved on March 1, 2024.
- 5. “Accounts Payable Automation Trends 2022: The Speed of Change | Tipalti Europe”Retrieved on March 1, 2024.
- 6. “Accounts Payable Automation Trends 2022: The Speed of Change | Tipalti Europe”Retrieved on March 1, 2024.
- 7. “Accounts Payable Automation Trends 2022: The Speed of Change | Tipalti Europe”Retrieved on March 1, 2024.
- 8. “Ardent Partners’ AP Metrics that Matter in 2023”Retrieved on March 1, 2024.
- 9. “Ardent Partners’ AP Metrics that Matter in 2023”Retrieved on March 1, 2024.
- 10. “Ardent Partners’ AP Metrics that Matter in 2023”Retrieved on March 1, 2024.
- 11. “Accounts Payable Automation Trends 2022: The Speed of Change | Tipalti Europe”Retrieved on March 1, 2024.
- 12. “Ardent Partners’ AP Metrics that Matter in 2023”Retrieved on March 1, 2024.
- 13. “Ardent Partners’ AP Metrics that Matter in 2023”Retrieved on March 1, 2024.
- 14. “Digitizing Accounts Payable and Receivable to Boost Efficiency and Enable Growth”Retrieved on March 1, 2024.
- 15. “Digitizing Accounts Payable and Receivable to Boost Efficiency and Enable Growth”Retrieved on March 1, 2024.
- 16. “Digitizing Accounts Payable and Receivable to Boost Efficiency and Enable Growth”Retrieved on March 1, 2024.
- 17. “Digitizing Accounts Payable and Receivable to Boost Efficiency and Enable Growth”Retrieved on March 1, 2024.
- 18. “Ardent Partners’ AP Metrics that Matter in 2023”Retrieved on March 1, 2024.
- 19. “Ardent Partners’ AP Metrics that Matter in 2023”Retrieved on March 1, 2024.
- 20. “Accounts Payable Automation Trends 2022: The Speed of Change | Tipalti Europe”Retrieved on March 1, 2024.
Next to Read
NetSuite AP Automation Analyzed Based on 200+ Reviews in '24
Dynamics AP Automation: 5 Case Studies & Key Features in '24
10 AI Applications in Accounts Payable (AP) Processes for 2024
Related research
Invoice Capture: Benefits, Use Cases, & Top Vendors in 2024
Comments
Your email address will not be published. All fields are required.