

According to neuroscience studies, people tend to transmit information by 90 % more in a visual format, which is why they can follow directions in the visual format 323% better than text format.1
By the same token, business leaders can leverage process visualization to ensure that every team understands what end-goal a process aims to deliver, how processes function and what are their responsibilities while executing the process.
Such improvement in communication can:
- shorten the meeting time,
- facilitate knowledge management,
- fasten the decision-making,
- and ensure data-driven culture.
Despite such benefits, business analysts might hesitate visualizing a process because they might fail to:
- Apply it into the accurate use case,
- Choose the relevant technique and diagram,
- Complete the visualization in a given time span.
In this article, we’ll cover how to visualize your processes, 8 use cases where you can apply process visualization, and some of the important techniques and diagrams.
What is process visualization?
Process visualization provides an end-to-end overview of a process flow including all the steps taken, sub-processes, activities, data inputs and outputs, and risk objects.
Analysts can benefit from visualization to illustrate a customer journey or a supply chain as it is, plan a new process, or ensure that the process complies with the ideal model.
How to best visualize a process?
Process visualization can be done manually or automatically, with the help of a software.
Manual process visualization can be useful for simple processes in a small organization. However, processes are often complicated and include several intersectionalities even in a small-scaled business, turning manual process visualization into a long project.
Therefore, we recommend leveraging an automated process visualization tool, such as process mapping software or a process intelligence tool, such as process mining and modeling.
Process mining can extract your process data from IT systems, analyze your processes and plot a comprehensive map automatically, shortening the process visualization project.
Leading process mining vendors offer task mining capability for you to capture user-interaction, so you can record the execution practices of the employees and include all relevant documents, such as excel and spreadsheets.
By using process mining, you can visualize your process model without going through these visualization steps of:
- Selecting the relevant technique and diagram
- Understanding the workflow
- Collecting data
- Designing and optimizing visuals
8 Process Visualization Use Cases
Visuals can be helpful for:
- Process planning and designing: Process visuals are an important stage of process planning and design since such visuals allow identifying relevant information for the optimal operations.
- Process documentation: Process visualization is a part of process documentation since process maps and models provide more details on tasks and operations.
- Process risk assessment: Process maps can disentangle the process complexity and help assess process risks.
- Process analysis: Detailed process visuals can streamline and improve process analysis.
- Process compliance: Process maps can facilitate estimating the overall compliance level with ideal processes, rules and regulations.
- Process improvement: In process visuals, you can notice areas for improvement such as delays, unnecessary steps and other bottlenecks.
- Process automation: Visuals are useful to identify redundant and error-prone tasks and activities to automate.
- Process controls and standardization: Mapping the processes allows checking for the variations which are the different traces or process paths in activities and execution practices and standardizing them.
Process visualization techniques
Process visualization varies based on the complexity of the process, the use case the visuals are required for, and the end-goal the visuals aim to deliver.
Some of these techniques include:
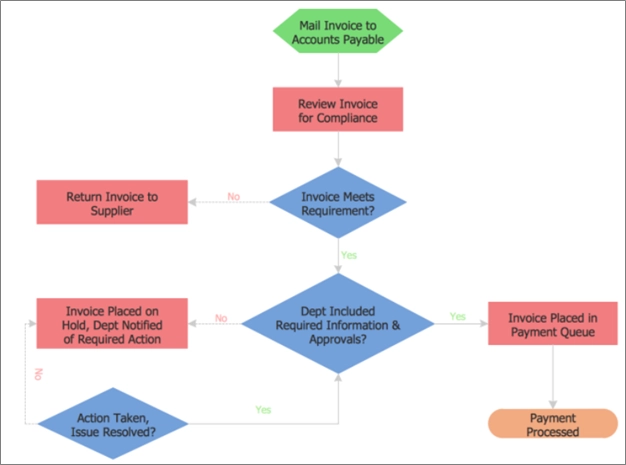
- Flowchart mapping: Process flowcharts describe the flow of the process. They are typically used to map out simple processes. For instance, administrative teams in a university receive application forms and they are required to forward these to the relevant units to be viewed and then send automated emails to the candidates to inform them of their rejections or acceptance.
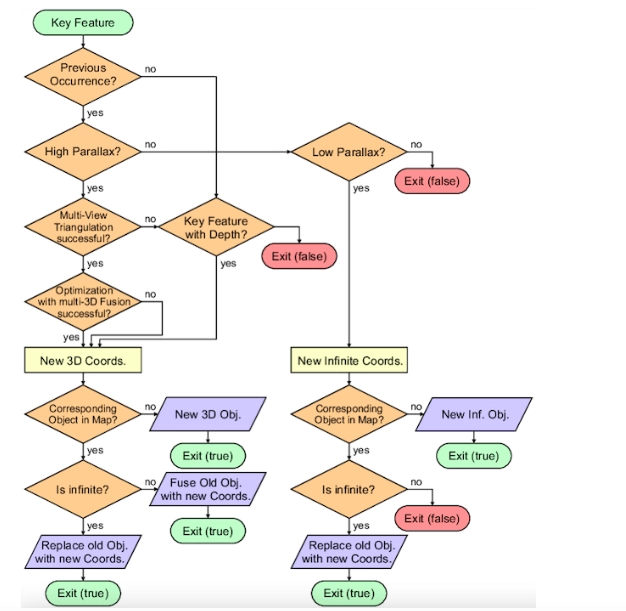
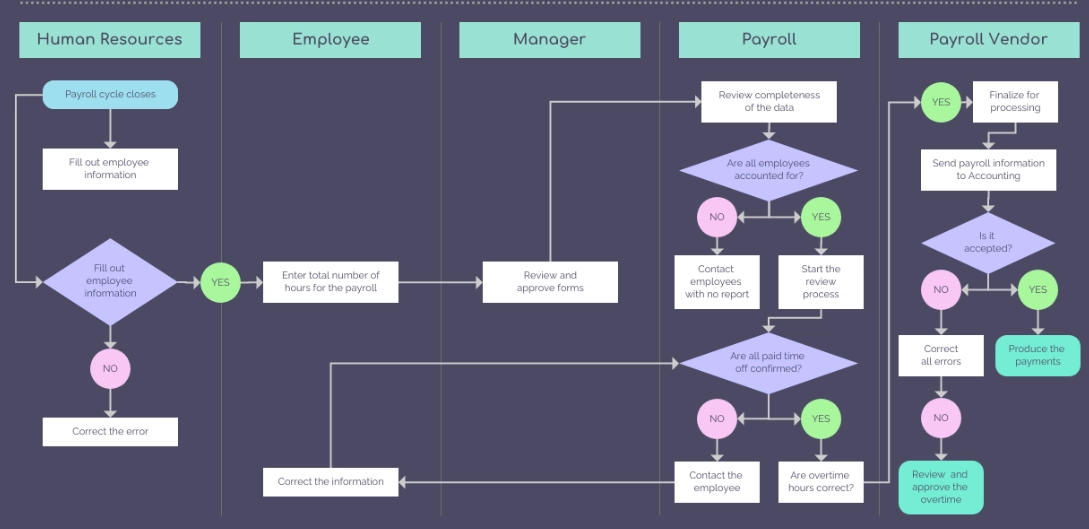
- Process mapping: It outlines process steps and decisions in detail. They show tasks, materials and information and how they relate to one another through the process. For example, an HR department can map the on-boarding process for the new employees to identify inefficient activities or unnecessary steps in order to optimize the process.
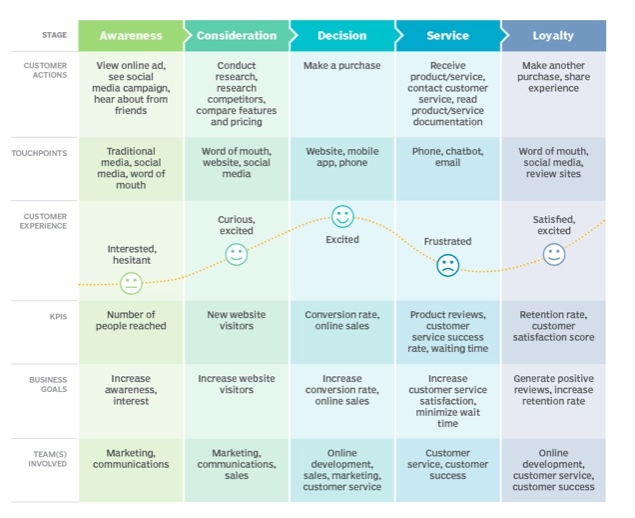
- Journey mapping: It visualizes customer’s experience step by step while purchasing a product or service. They help understand customer view and optimize product, service or website to increase customer satisfaction.
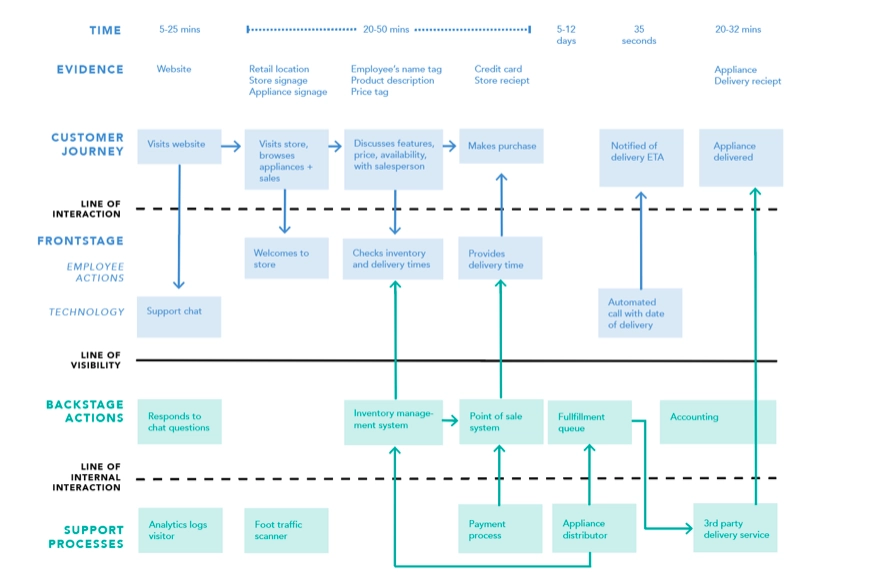
- Process blueprinting: It illustrates the business-to-consumer (B2C) touch-points in a selected process by mapping customer journey, all internal actions and tools that support customer activities, employee- customer interactions, and secondary processes.
For instance, if your aim is to run a process analysis for your e-commerce processes to enhance customer experience, then you are likely to choose a customer journey mapping or process blueprinting.
On the other hand, if you aim to identify and automate your manual tasks, you should probably map out the activities and tasks in a sequential order to see interactions. In such a case, you should utilize process mapping.
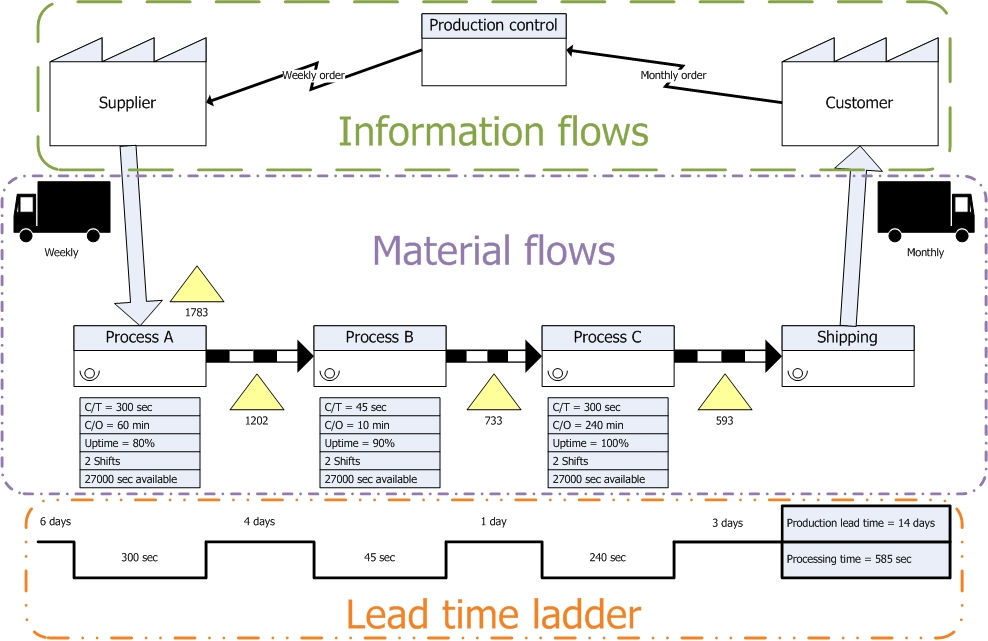
5. Value Stream Mapping: Value stream mapping identifies points the process requires improvement. These enhancement options include:
- Delays resulted from a prior step in the workflow
- Unnecessary steps in the given process
- Prolonging activities
- Producing goods and services more than demanded
- Defects and ill-performing services
- Complicated communication flow among employees or with suppliers
Diagrams used in process visualization
Process visualization benefits from diagrams and it is important to choose the right diagram.
- Process flows: This diagram maps out the workflow including individual tasks and objectives at a high level. Such flows are useful to develop and to adopt a new process.
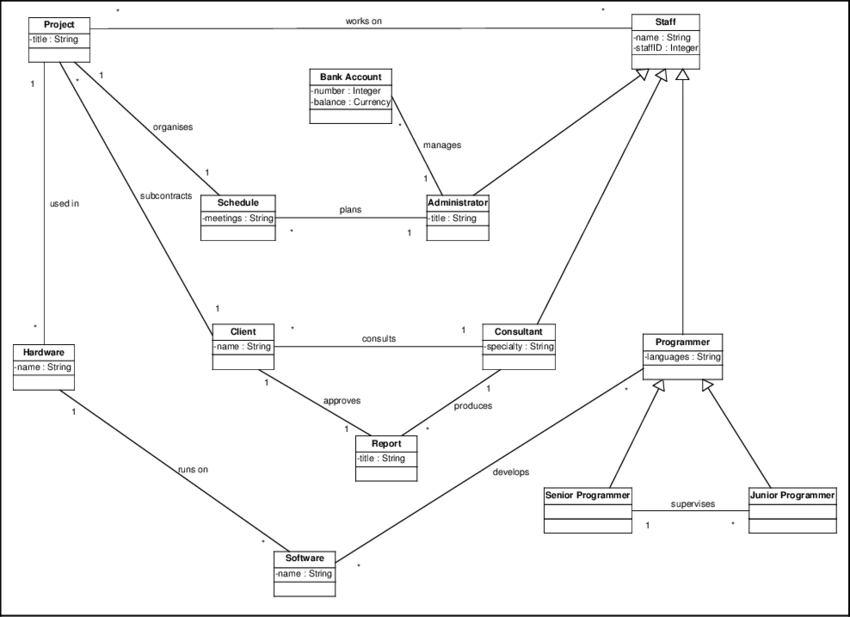
2. UML Diagrams: Unified Modeling language diagrams analyze, design and implement software programs. Some UML diagrams are applicable to business process modeling.
Specifically, the most preferred UML diagrams include:
- Structural diagrams that analyze process structure:
- Class diagrams
- Object diagrams
- Component diagrams
- Behavioral diagrams that illustrate process agents and other factors:
- Activity diagrams
- Use case diagrams
- Interaction overview diagrams
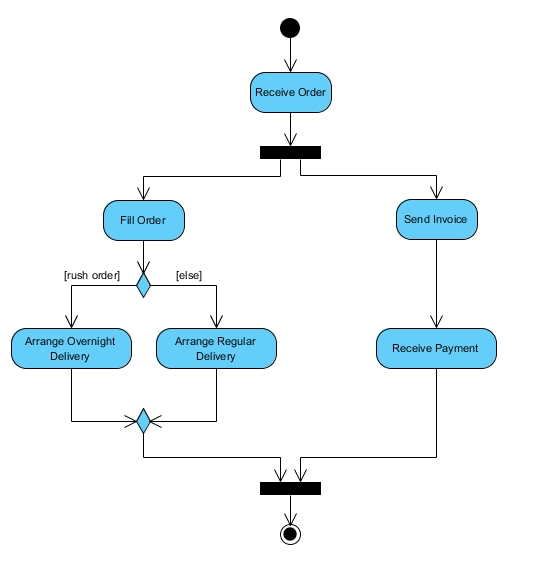
3. Activity diagrams: These flowcharts show the series of events and are used to visualize technical processes for employees to understand the system’s functions. Order fulfillment process activity diagram shows once order is received the next activity is to send an invoice and contact the team to fill the order until the payment is received and the delivery is completed.
- Swimlane diagram: Such diagrams display a workflow as smaller flows and units to stress the interactions and help easily identify inefficiencies. Such diagrams should be preferred for complex processes that have various sub-processes that are interrelated and independent.
- BPMN diagram: BPMN stands for business process modeling notation and it aims to simplify interpretation across the organization by uniforming notations (e.g., geometric symbols and arrows). A company that wants to improve a process can model the process via BPMN diagram to enable different teams’ collaboration.

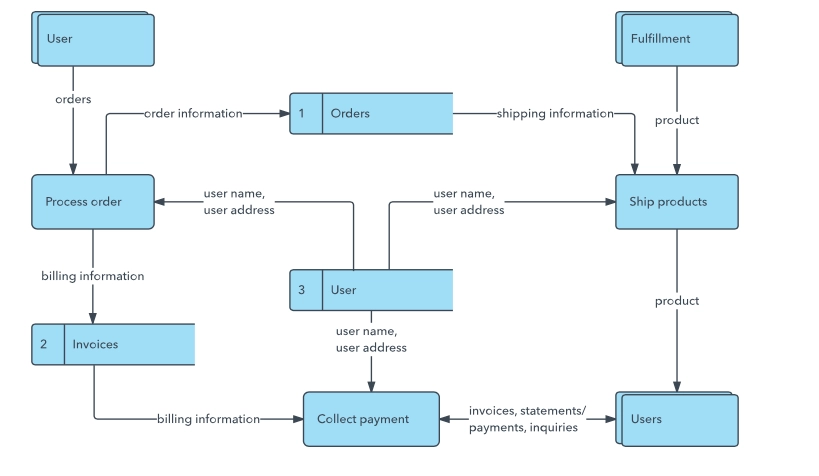
- Data flow diagram: Such diagrams portray the data points in operating systems. It can be useful to show processes where data collection and recording in a database or verifying order on the e-commerce tool.
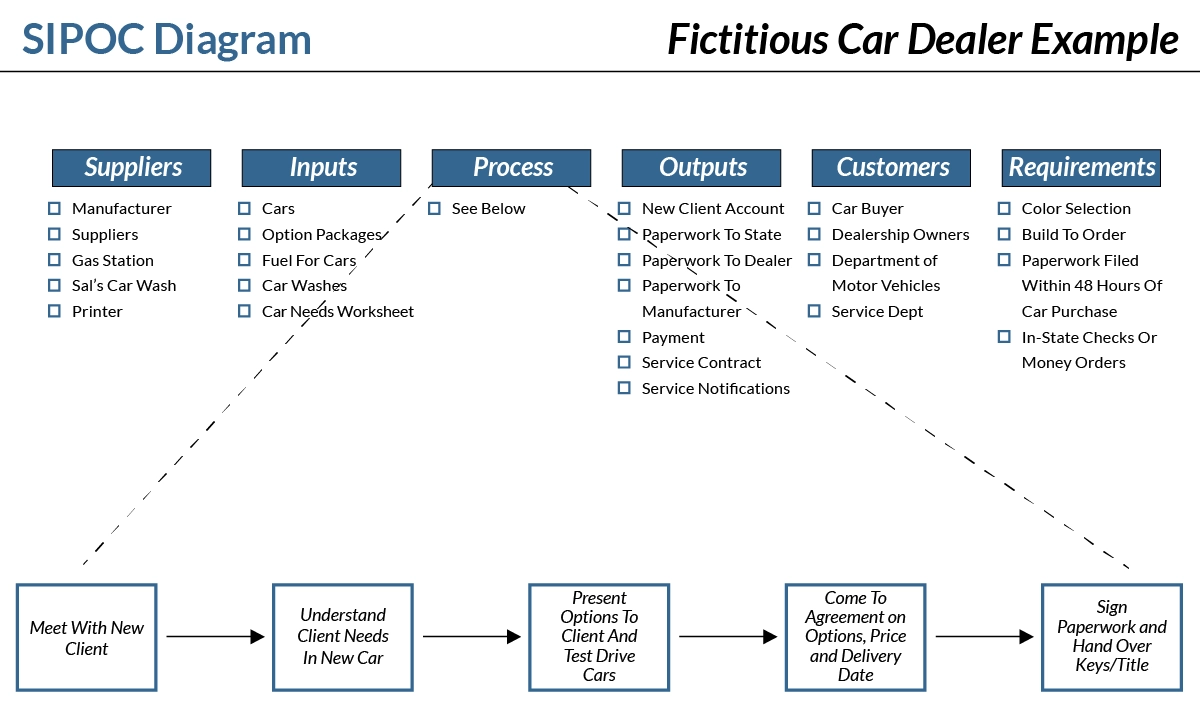
- SIPOC diagram: Supplier, input, process, output, customers diagram is a specific type of swimlane diagram that delivers information on internal and external data flow. Its ultimate goal is to improve customer experience.
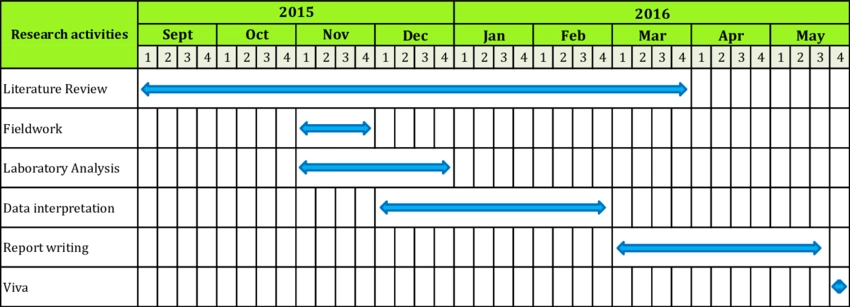
8. Gantt Charts
Gantt charts are an outdated methodology for process modeling which shows the time allocated for each task by indicating:
- Start time
- End time
- Time it takes until completed
Gantt charts are helpful to understand time-sensitive processes. However, they are oversimplified diagrams so they are not useful for complex business processes.
FAQs
What are the three types of visualization?
The three main types of visualization are:
– Data Visualization: Charts, graphs, and dashboards to present quantitative data.
– Information Visualization: Illustrates complex concepts, such as flowcharts and infographics.
– Process Visualization: Depicts workflows and operations, using diagrams like flowcharts or Gantt charts.
What is the best process visualization tool?
The best tool depends on the use case. They excel in creating flowcharts, organizational charts, and process maps. Features like drag-and-drop functionality, cloud integration, and real-time collaboration make them highly effective for process visualization.
How to visualize step by step process?
1. Define steps: Break the process into clear, sequential stages.
2. Select format: Use tools like flowcharts or Gantt charts.
3. Visualize connections: Add arrows or timelines to show relationships.
4. Simplify visuals: Use icons or shapes for clarity.
5. Review and revise: Ensure logical flow and accuracy.
Further reading
Explore more on process visualization by checking out:
- What is Process Simulation & Its Best 3 Use Cases?
- Complete Guide to Digital Twin of an Organization (DTO)
Revise our data-driven and comprehensive DTO, task mining and process mining vendor list, if you want to leverage process mining.
You can benefit from different technologies and solution to implement process visualization, such as:
- Workflow management software
- Business process management software
- Low-code/No-code development platform
- Onboarding software
Let us know, if you still have some doubts:
External Links
- 1. Levie, H. & Lentz, R. (1982) “Effects of text illustrations: A review of research.”SpringerLink. Revisited January 6, 2023.
- 2. ResearchGate - Temporarily Unavailable.
- 3. Enaohwo McGab, Owen (2020). “The Ultimate Guide to Business Process Mapping.” Sweetprocess. Revisited February 2, 2023.
- 4. Mixon, Erica; Horwitz, Lauren (2020). “Customer Journey Map.” Techtarget. Revisited February 2, 2023.
- 5. Gibbons, Sarah (2017). “Service Blueprints: Definition.” NNGroup. Revisited February 2, 2023.
- 6. “Value-stream mapping.” Wikipedia. January 19, 2023. Revisited February 2, 2023
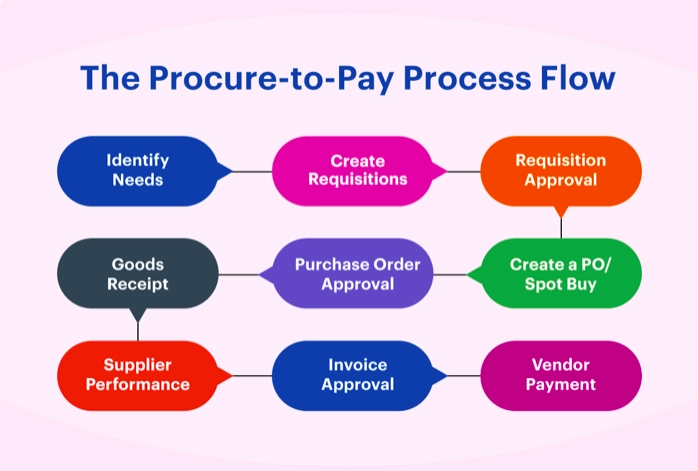
- 7. “The Ultimate Guide to a Truly Effective Procure-to-Pay Process.” Kissflow. January 10, 2023. Revisited February 2, 2023.
- 8. Purchase, H. C., McGill, M., Colpoys, L., & Carrington, D. (2001, December). “Graph drawing aesthetics and the comprehension of UML class diagrams: an empirical study.” In InVis. au (pp. 129-137). Revisited February 2, 2023.
- 9. “What is Activity Diagram?” Visual-Paradigm. Revisited February 2, 2023.
- 10. Oana, Cristian (February 25, 2022). “10+ Swimlane Diagram Templates and How to Create Them.” Venngage. Revisited February 2, 2023.
- 11. “BPMN Business Process – Hardware Retailer.” Sparx Systems. Revisited February 2, 2023.
- 12. “What is a Data Flow Diagram?” Lucidchart. Revisited February 2, 2023.
- 13. Simon, Kerri (2010). “SIPOC Diagram.” ISIXSIGMA. Revisited February 2, 2023.
- 14. Mohd Ali, S. A., Leong Wan, V., & Payus, C. M. (2015). “Environmental Science: Scientific Project Guidelines.” ResearchGate. Revisited February 2, 2023.


Comments
Your email address will not be published. All fields are required.