Data Visualization

Unlock the Value of Business Data with Data Architecture in '24
According to McKinsey, by 2025, most employees will use data to optimize their workflows. However, many organizations today still face data quality issues. For example, data duplication occurs as a result of storing it in multiple departmental databases and silos, which reduces the data’s usefulness.
Jan 24 min read
Top 45 Data Visualization Tools to Get Insights in 2024
Humans are naturally visual creatures, so it is no surprise that we search for better ways to portray and understand what data is telling us.
Jan 125 min read
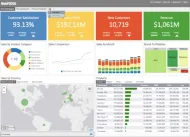
![Improving Understanding with Data Visualizations [2024 update]](https://research.aimultiple.com/wp-content/uploads/2018/05/data-visualization-190x105.png.webp)
Improving Understanding with Data Visualizations [2024 update]
As we become better at collecting and analyzing data, we also have to become better at explaining what it all means. Data visualization is the use of algorithms to create images (graphical and pictorial) from data so that humans can more effectively understand and respond to that data.
Aug 95 min read