In-Depth Look at AKIPS Network Monitoring Software in 2024

Cem is the principal analyst at AIMultiple since 2017. AIMultiple informs hundreds of thousands of businesses (as per Similarweb) including 60% of Fortune 500 every month.
Cem's work has been cited by leading global publications including Business Insider, Forbes, Washington Post, global firms like Deloitte, HPE, NGOs like World Economic Forum and supranational organizations like European Commission. You can see more reputable companies and media that referenced AIMultiple.
45% of IT professionals don’t know the full configuration of their network. This means that whenever a problem occurs within a certain point in a complex network, it becomes harder to detect the problem and troubleshoot. AKIPS is a large-scale network monitoring software for sustaining network management.
In this article, we will delve into the features of AKIPS network monitoring software in detail.
AKIPS Overview
AKIPS Network Monitor is an infrastructure monitoring software solution designed to meet the needs of network engineers and enterprises seeking scalable network monitoring solutions. It provides comprehensive monitoring capabilities, offering real-time insights into the performance of an entire network. As an enterprise-grade infrastructure performance monitoring tool, AKIPS empowers network engineers to effectively monitor and manage the health of their network infrastructure.
With its scalable architecture, AKIPS is well-equipped to handle the demands of large enterprise networks, offering unparalleled visibility and control over more than 1 million interfaces.
AKIPS Network Monitoring Software Features & Capabilities
Network visibility
1- Network discover
- Automatic Device Detection and Configuration: The software can automatically find new devices and update settings for existing ones, even in large networks, typically completing this in about 10 minutes for a network with 5000 switches and routers.
- Customizable Scanning: You can adjust the software to look at your whole network or just one device, set the range of IP addresses to scan, and control how fast the scanning happens.
- Support for Modern Network Standards: It works with both IPv4 and IPv6 addresses and all versions of SNMP (Simple Network Management Protocol), which is a common way to manage network devices.
- Vendor-Specific Support: The software can recognize and work with special features from different network device makers.
- Easy Filtering: You can quickly find devices by their name, the company that made them, what model they are, or where they’re located in your network.
2- Intelligent polling
AKIPS uses adaptive polling to manage network load.
- Reduced SNMP Traffic: Cuts down network traffic by 60%
- Adaptive Polling: The system increases the interval between checks for inactive elements up to three minutes, reverting to more frequent checks if changes occur.
- Integrated System: Direct communication between the poller and databases, avoiding complex SQL queries.
3- Syslog & SNMP traps
AKIPS tools are designed to manage syslog messages and SNMP traps, which ensure network issues are detected early.
- Custom Alerts: Set up warnings based on specific patterns, times, or device types.
- Advanced Filtering: Sort through messages using criteria like IP address, content, or device.
- Data Forwarding: Send system messages and alerts to up to 10 different locations at once.
- Understand Vendor Codes: Translate unique codes from device manufacturers for clarity.
- Secure Communication: Protect messages using verified and encrypted methods to ensure safety (SNMPv3 authenticated (SHA/MD5) and encrypted (DES, 3DES, AES128/192/2)).
4- NetFlow
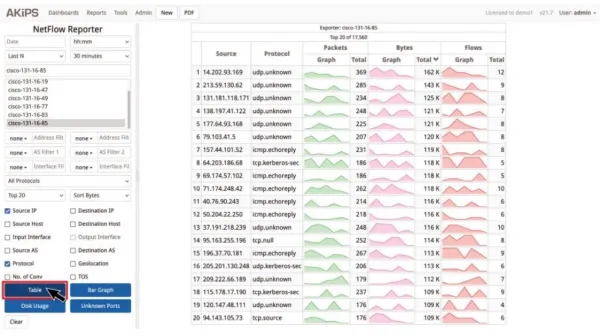
Figure 2. AKIPS netflow reporter dashboard
- High Capacity: It can handle up to 500,000 flow records every second, accommodating very busy networks.
- Data Distribution: Can send flow data to up to 10 different locations for analysis or backup.
- Detailed Analysis: Provides rankings of the most active senders, receivers, types of traffic, and individual data flows.
- Conversation Tracking: Counts the number of data exchanges for each source IP address.
- Flexible Filtering: Allows sorting of data by IP address, type of data, or Autonomous System (AS) details.
- Enhanced Insights: Detects where data is coming from geographically and identifies data types that aren’t immediately recognizable.
- Name Resolution: Converts numeric IP addresses into more understandable domain names for easier identification.
5- Config crawler
The AKIPS config crawler collects configuration data from network devices securely, speeding up the process significantly by using multiple connections. It also includes a version-control system for easy comparison and management of configuration changes. Key features include:
- Customizable scripts for flexible data collection
- Automated grouping to target devices efficiently
- Scheduling options for regular data collection
- Tools to compare different versions of configurations
- Options to view and download specific configurations
Alerts and reporting
6- Alerting and notifications
- Alerts and Event Handling: The system notifies you about important or unusual activities across all devices on your network.,
- Filtering: It can ignore irrelevant notifications, reducing unnecessary information or “noise.”
- Custom Rules: You can set up specific criteria using regex (a way to search text) and group devices for more targeted alerts.
- Thresholds: Define your own limits for when an alert should be triggered.
- Prioritization: Highlight the most critical issues to address them promptly.
- Alert Management: Decide who gets notified about what, ensuring the right people are informed.
7- Reporting
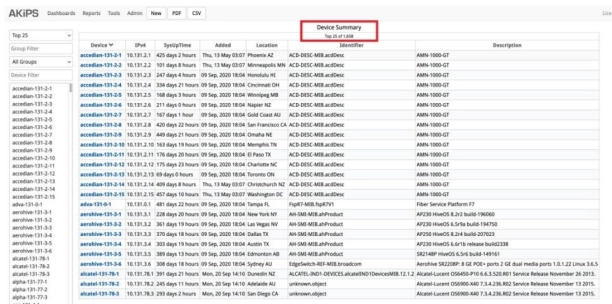
Figure 3. Running basic reports in AKIPS
- Interactive Tables: Tables within the software allow users to filter and rank data instantly, enabling quick access to relevant information.
- Quick Report Retrieval: Users can easily locate any desired report without delays, providing instant access to detailed information.
- Broad Reporting and Vendor Coverage: The software offers a wide range of reporting options and supports various vendors, ensuring comprehensive coverage of network devices and servers.
- Customizable Grouping: Users have the flexibility to customize how data is grouped in reports, and customize the presentation to their specific needs.
- Real-time Graphs: The software provides real-time graphical representations of data. This allows users to visualize network performance and trends as they occur.
- Detailed Historical Data: Users can drill down to 60-second intervals for the previous three years without data aggregation, providing detailed insights into historical performance metrics.
8- Dashboards
Device Dashboard:
- Vitals: Provides essential health metrics like ping response, CPU load, memory usage, and temperature. Thus administrators can assess the overall health of a device.
- Interfaces: Displays information about the interfaces on the device, including their status, speeds, and traffic statistics, which is crucial for understanding network connectivity and performance.
- Events: Lists instances of critical events, syslog messages, traps, and breaches of preset thresholds. These also enable administrators to stay informed about any issues or anomalies affecting the device.
Interface Dashboard:
- Real-time Graphs: Offers graphical representations of interface state, speed, usage, and traffic volumes, providing administrators with visual insights into interface performance in real-time.
- Detailed Summary Line: Provides key details about each interface, including its current state, speed, and type. This way administrators can identify and troubleshoot interface-related issues.
- Drill Down: Allows users to examine interface data in 60-second intervals for the previous three years without data aggregation, facilitatie detailed analysis and historical tracking of interface performance.
Events Dashboard:
- Instances of Events: Displays critical events defined by users, such as core interface failures, ensuring administrators are promptly notified about significant network issues.
- Threshold Breaches: Alerts users to breaches of predefined thresholds for critical parameters. Administrators can use these to identify and address potential performance or security issues.
- Real-time Graphs: Provides graphical representations of network events, enabling administrators to visualize the frequency and severity of events occurring in real-time, facilitating proactive monitoring and response.
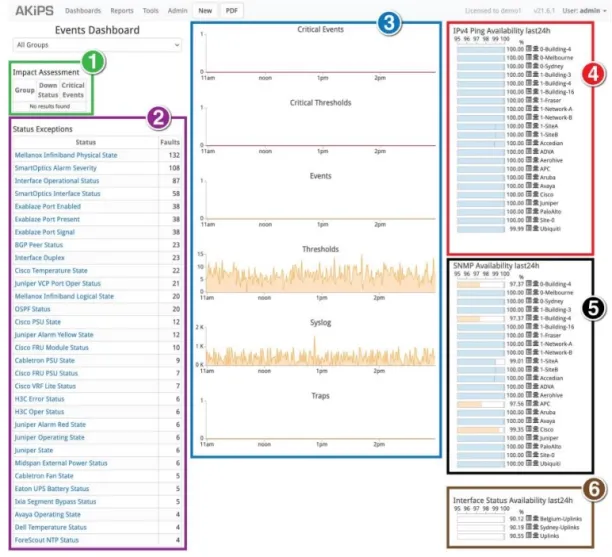
Figure 4. AKIPS dashboard
Integration & customisation capabilities
9- Integration
- Integration with Third-Party Applications: This feature allows AKIPS to send alerts generated by the monitoring system to other software applications commonly used for incident management and communication.
- Compatible Applications: AKIPS integrates with popular tools such as Microsoft Teams, Opsgenie, PagerDuty, ServiceNow, Slack, and Splunk, ensuring flexibility and compatibility with various existing workflows.
- Included in Subscription: There are no additional costs associated with using the integration feature; it is part of the standard subscription package offered by AKIPS.
10- Grouping
- Grouping Functionality: This feature allows you to organize the devices and technologies in your organization in a logical manner.
- Customizable Grouping: You can create groups based on various criteria such as technology type, location, or function, providing flexibility in how you structure your network.
- Built-in Grouping Rules: All other features and functionalities within AKIPS are based on the grouping rules you define. This makes sure that your monitoring setup aligns with your organization’s structure and needs.
- Automated Group Creation: When performing network discovery, AKIPS automatically creates groups based on factors like interface speed, type, and VLANs, saving you time and effort in organization.
- Access Control: The grouping functionality also includes access controls, allowing you to manage who can view and interact with specific groups of data. This way you can enhance security and privacy measures.
11- Site Scripting
- Powerful Site-Scripting Framework: This feature allows users to interact with the AKIPS database without needing to understand the complex underlying code. It simplifies the process by hiding technical details, making it easier for users to work with.
- Internal APIs Revealed: Through the site-scripting framework, AKIPS exposes its internal APIs directly, eliminating the need for additional layers or modules. Users can access the same APIs used internally, without requiring extra installations.
- Stable API: The underlying API of AKIPS is stable and rarely changes. This ensures that upgrading AKIPS won’t break existing site scripts, providing consistency and reliability.
- Pre-Written Integration Modules: The framework includes pre-written integration modules for common applications like Opsgenie, Slack, and ServiceNow. This simplifies the integration process for users, saving time and effort.
- Clean and Simple API: The API provided is stable, with no messy switches or complicated configurations. This makes it easier for users, even non-developers, to work with the scripts.
- Cost Effective Network Solution: Ready-to-use and simple site scripts help save money for users, as there’s no need to hire DevOps programmers. This lowers the barrier to entry for utilizing the functionality of AKIPS.
Pricing
- 30 day free trial
- For detailed pricing information, you can contact AKIPS.
For more on network monitoring
- Top 5 Network Performance Monitoring Solutions
- Top 5 Network Traffic Analysis Software Based on 1.3k Reviews
- Top 10 Network Monitoring Software based on 3,000+ Reviews in ’24
- Top 5 LogicMonitor Competitors in 2024 based on 2K+ Reviews
- Top 4 Solarwinds Network Performance Monitor Competitors in 2024
If you have questions or need help in finding vendors, feel free to reach out:
Transparency Statement: AIMultiple works with B2B tech vendors, including AKIPS.

Cem is the principal analyst at AIMultiple since 2017. AIMultiple informs hundreds of thousands of businesses (as per Similarweb) including 60% of Fortune 500 every month.
Cem's work has been cited by leading global publications including Business Insider, Forbes, Washington Post, global firms like Deloitte, HPE, NGOs like World Economic Forum and supranational organizations like European Commission. You can see more reputable companies and media that referenced AIMultiple.
Throughout his career, Cem served as a tech consultant, tech buyer and tech entrepreneur. He advised enterprises on their technology decisions at McKinsey & Company and Altman Solon for more than a decade. He also published a McKinsey report on digitalization.
He led technology strategy and procurement of a telco while reporting to the CEO. He has also led commercial growth of deep tech company Hypatos that reached a 7 digit annual recurring revenue and a 9 digit valuation from 0 within 2 years. Cem's work in Hypatos was covered by leading technology publications like TechCrunch and Business Insider.
Cem regularly speaks at international technology conferences. He graduated from Bogazici University as a computer engineer and holds an MBA from Columbia Business School.
Sources:
AIMultiple.com Traffic Analytics, Ranking & Audience, Similarweb.
Why Microsoft, IBM, and Google Are Ramping up Efforts on AI Ethics, Business Insider.
Microsoft invests $1 billion in OpenAI to pursue artificial intelligence that’s smarter than we are, Washington Post.
Data management barriers to AI success, Deloitte.
Empowering AI Leadership: AI C-Suite Toolkit, World Economic Forum.
Science, Research and Innovation Performance of the EU, European Commission.
Public-sector digitization: The trillion-dollar challenge, McKinsey & Company.
Hypatos gets $11.8M for a deep learning approach to document processing, TechCrunch.
We got an exclusive look at the pitch deck AI startup Hypatos used to raise $11 million, Business Insider.
To stay up-to-date on B2B tech & accelerate your enterprise:
Follow onNext to Read
LAN Monitoring Software in 2024: Features & Top 5 Tools
Related research
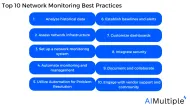
Top 10 Network Monitoring Best Practices in 2024
Comments
Your email address will not be published. All fields are required.