Investors are always searching for new sources of data that can provide an edge in their investment strategies. Alternative data is important for investment because it provides investors with new and unique insights into companies, industries, and markets.
Explore why alternative data is important for investment, the top 10 alternative data use cases, and more:
Alternative data use cases for investment & their sources
Social media data
1. Social media sentiment
Social media perception has been shown to influence the stock process, especially meme stocks.
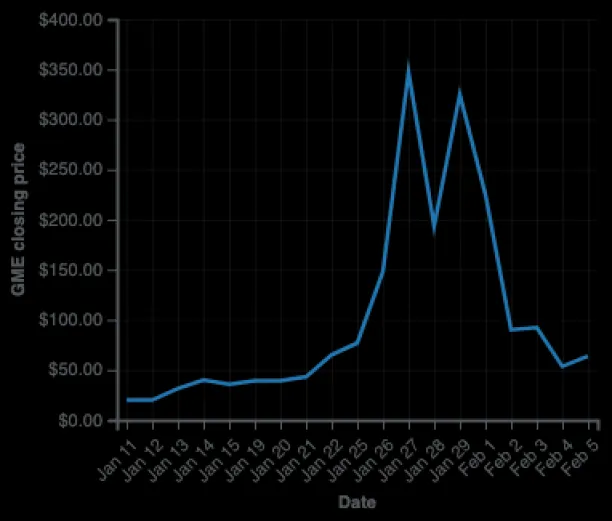
In 2020, for instance, Keith Gil, a citizen investor, rallied a subreddit to buy Game Stop’s stocks (GME) to artificially raise its price.1 Gil had looked at online sentiment around GME.2 He’d observed that animosity towards “Wall Street’s greed,” and investors’ nostalgic connection to the Game Stop brand, could push investors to buy more GME shares. Banking on this, Gil reportedly turned his $53K GME portfolio into $50M and cashed out.3
Figure 1. Investors bought worthless GME stocks and raised the stock price
2. Leadership behavior monitoring
Especially for public companies with eccentric leaders, their online behavior can impact stock prices.
For example, in 2018, Tesla’s stock price decreased 9% after Elon Musk smoked weed on a live podcast.4 In another instance, Musk tweeted that he’d take Tesla private, which consequently resulted in another round of sell-offs and an SEC investigation.5 ,6
Figure 2. Elon Musk smoked weed on a live podcast

Source: BBC7
Unconventional public behavior of company leaders can affect stock prices. So their online activity can be an alternative data to be used in forecasting short-term stock price movements.
3. Understanding company culture
Investors learn more about the target company’s culture by monitoring employees sharing their experiences on Glassdoor or LinkedIn.
With the rise of the Great Resignation movement and negative sentiment towards employment, it’s important to ensure the company you’re investing in has the infrastructure to keep employees happy, reduce churn, and attract new talents.8 Even if a company has strong revenue growth, it can’t sustain it without fresh hires and innovation. Reading former employees’ stories on their workplace experience can shed some light on the company’s culture.
For instance, former employees could talk of discrimination, lack of mental health support, or management cliques. Such comments could dissuade potential employees of choosing to work there. So investors should know the types of cultural transformation that are needed to happen.
Web data monitoring
Web (data) monitoring is scouting the broader internet (i.e. not just social media) for data on other points of interest that could affect the investment decision.
4. Monitoring press releases for clients & alliances
Press releases reveal new clients and partnerships which can provide crucial insights to investors about a company’s future.
Press releases and client references on the company website can answer all these questions about the company:
- Are they expanding into popular and sustainable fields?
- Are they making the right investments?
- Are their M&As going to help or hurt shareholders’ profits?
For instance, at the beginning of 2021, Microsoft announced was purchasing Activision Blizzard, a video game developer.9 This acquisition changes Microsoft’s growth prospects as it helps them grow in gaming and possibly in the metaverse market.
5. Monitoring review platforms for public sentiment
Investors who know how customers perceive a brand’s products can better estimate a brand’s growth prospects and potential marketing & user experience challenges.
Let’s say a venture capitalist wants to invest in a small business or startup. In addition to familiarizing themselves with financial information, the investors can go on Amazon, TrustPilot, or any regional or international e-commerce platform, to analyze customer reviews and better understand the quality of the product and the customer experience.
6. Monitoring patent filings to identify innovation rate
Companies are disrupted faster today. It is important to know how innovative a company is to understand whether it will be a good long-term investment. Patent filings that are publicly published help investors gain a better understanding of the areas that companies are researching and the results of their research.10
7. Monitoring demographic data for trend analysis
Investors can predict the profitability of a business venture concerning the data they get on the demographics and socioeconomic factors which are published publicly on the country’s open data portals.
For example, opening a beer store requires more than just finding the best wheat and brewing equipment. If you run a brewery in a neighborhood where men outnumber women, for example, you may see increased foot traffic.11 It’s been observed that there is a positive correlation between US regions with the highest income inequality and the residents’ preference for “luxury” items.12
From census and socioeconomic data, for example, the Gini coefficient, investors can:
- Predict consumer demand for their products,
- Get regional-specific insights into the marketing and operating campaigns that they could run (i.e. investing in high-end glassware for customers, attaching a “luxury” tagline to advertisements, setting up shop in strategic locations, etc.).
For example, all these inputs can be used in predictive models to generate a more accurate cash flow analysis, based on the target audience.
8. Monitoring geographical footprint
Physical presence matters in markets like retail and logistics. One way to measure this is by looking at a company’s list of stores on its website. Investors can analyze each location to learn more about the competition they face, their geographical positioning, customer reviews, and more.
For instance, in 2012, a hedge fund was sued by its clients for neglecting to conduct “basic due diligence” on a Chinese forestry company in which it had invested.13 It’s alleged that the Chinese company had misstated the true value of its forestry assets. A geographic footprint analysis could have revealed the true value of these assets.
IoT & satellite data
IoT & satellite data is information that is collected, in different formats, via devices that can monitor their ambient environment, process them (if applicable on the edge), and transmit it onto the cloud for data-driven decision making.
9. Monitoring business activity with sensors & IoT
It’s important to monitor the business activity of the project that investors are considering. If they cannot physically inspect the locations, they can leverage various types of IoT data that can give insight into the matter.
Some alternative data providers track the locational data of people by their smartphone applications. They then sell the data to their clients. For instance, in 2018, Elon Musk promised to increase Model 3 production. Thasos, an American alternative data provider, was able to track, through their phones, the workers’ locational data at the production plant to conclude that there appeared to be an increase in shift hours and congestion in the area. It’s claimed that Thasos’ clients who had access to this data bought shares early, and saw a 9.1% increase in value once the next quarterly report showed higher production and sales.
10. Monitoring business activity with satellite images
Investors can also have visual access to the project’s location. Planet.com, for example, provides its clients with real-time satellite images that investors can leverage for monitoring the amount of population congestion, shipments, and other factors in the area.
Figure 3. Real-time satellite images

Source: Planet.com
Why is alternative data important for investment?
By October 2020, almost $239B of investments were made with the use of alternative data (e.g. satellite images, social media sentiment, news stories, etc.) in the due diligence process.14 Traditional financial data like earnings reports and balance sheets can be useful, but they may not provide a complete picture of a company’s performance or potential. By incorporating alternative data sources such as social media activity, satellite imagery, and web traffic, investors can gain a more comprehensive understanding of a company’s operations, customer sentiment, and market trends.
For instance, a fashion brand might have a YoY revenue growth. But income statements won’t show why/how, for instance, their female customer base has been shrinking. By reading user reviews, the investors can then see how apparel releases that had more male clothes than female could have one reason for the alienation of the female demographic.
What are the investment purposes of alternative data?
These alternative sources provide data evidence that enhances traditional investment analysis, offering deeper insights into company behavior, market trends, and consumer sentiment that might otherwise go unnoticed. Generally, alternative data can be used for three broad purposes:
1. To forecast public companies’ outcomes
Alternative data could signal the stock price movements of publicly traded companies. For instance, investors can leverage social media sentiment online to know the attitude of investors towards a certain stock.
2. To predict private company outcomes
Alternative data can be used in the due diligence and evaluation process of private companies that are looking for cash injections. Satellite images and CCTV cameras, for instance, could signal the amount of foot traffic a business is getting.
3. To estimate the ROI of investment projects
Alternative data, such as demographic data and socioeconomic factors, can be used to predict the ROI of business projects.
How to collect alternative data?
You can collect alternative data manually online. For instance, you can look up press releases, check Glassdoor, or visit Amazon to read customer reviews and employees’ experiences.
But if the investment is in a large company, there would be many points of interest, and consequently, data, to sort through and collect, not to mention the ever-changing nature of the information that one could come across on the internet. So manually scraping alternative data can be challenging and time-consuming.
Sponsored:
Bright Data’s Data Collector enables you to automate data scraping and extract any data you want from targeted websites, and have it sent to you in your desired format (e.g. CSV, JSON). By using Bright Data’s Data Collector, you will have access to exclusive, proprietary sets of alternative data, such as customer reviews, trend demographics, and more, that you can include in your decision-making process.
Public data sources can include:
- Social media websites like Twitter
- Review sources like Amazon
- Geo-information sources like Google Maps or Waze
- Other data sources like
- UC San Diego’s datasets on smart home IoT devices
- Uber’s trip data
- data.world’s IoT data sets
Paid data sources include numerous data sources including many on location tracking like
- SafeGraph
- Skyhook Foursquare
- Unacast
Microsoft’s Azure Maps is another paid resource that shares satellite images and IP traffic data. Investors can use these to learn more about the amount of foot traffic or business activity in the area.
Figure 4. Microsoft’s satellite imagery showing the congestion of people by tracking their smartphones’ location
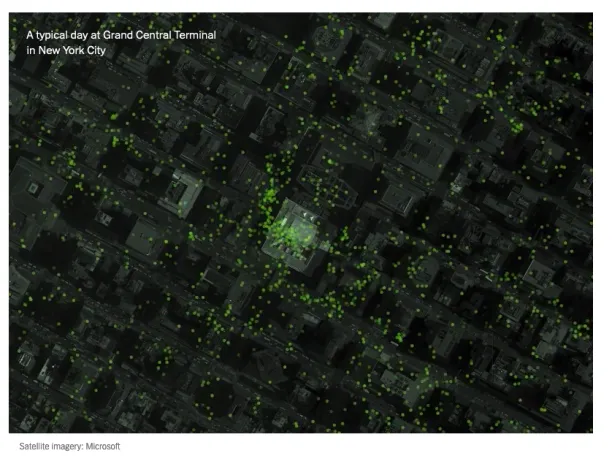
Source: NYT15
What are some alternative data examples?
Alternative data refers to any non-traditional data source that can be used to gain insights into companies, industries, and markets. Some examples of alternative data sources for investment include:
- Social Media Activity: Analysis of social media activity can provide insights into consumer behavior, sentiment, and trends. This can be particularly useful in industries such as retail, where consumer sentiment can have a significant impact on stock prices.
- Satellite Imagery: Satellite imagery can be used to monitor shipping activity, track inventory levels, and assess environmental impact. This can be particularly useful in industries such as logistics and agriculture.
- Web Traffic: Analysis of web traffic and search engine data can provide insights into consumer interest in particular products or services. This can be particularly useful in industries such as e-commerce and online advertising.
- Alternative Credit Data: Analysis of non-traditional data sources such as social media activity and online behavior can be used to assess credit risk for individuals and companies. This can be particularly useful in emerging markets where traditional credit scoring methods may be limited.
- Supply Chain Data: Analysis of supply chain data, including shipping activity and inventory levels, can provide insights into a company’s supply chain health. This can be particularly useful in industries such as retail, where disruptions in the supply chain can have a significant impact on stock prices.
- Sensor Data: Analysis of sensor data, including temperature, humidity, and other environmental factors, can be used to monitor production processes and assess equipment health. This can be particularly useful in industries such as manufacturing and agriculture.
Overall, alternative data sources provide investors with new and unique insights that can help them make more informed investment decisions and generate alpha. As more data sources become available and technology continues to advance, alternative data is likely to become an increasingly important tool for investors looking to outperform the market.
Sponsored
Coresignal offers B2B and B2C alternative data focused on professional profiles, companies, and employee reviews collected from public sources. Their data solutions include raw data (both fresh and historical from 20 different sources), multi-source company datasets, and API integrations. Additionally, they provide 200 free API credits.
For more on alternative data
If you are interested in learning more about alternative data, read:
- Everything You Need to Know About Alternative Data Analytics
- Top 5 Sources of Alternative Data
- Alternative Data: Make Better Investments Than Competitors
Moreover:
- If you believe your business would benefit from leveraging alternative data, we have our data-driven list of vendors.
- Sponsored:
- You can also get your data ready-made: scraped and filtered, from Bright Data’s data sets.
And we can help you find the right tool for your business:
External Links
- 1. GameStop Short-Sellers Reload Bets After $6 Billion Loss - Bloomberg. Bloomberg
- 2. Reddit - The heart of the internet.
- 3. Anarchy, in-jokes and trolling: the GameStop fiasco is 4chan-think in action | Dan Dixon | The Guardian. The Guardian
- 4. Tesla stock plummets after Elon Musk smokes weed on live show and two execs quit in one day. NBC News
- 5. How Elon Musk’s tweets move Tesla’s stock price | Vox. Vox
- 6. SEC.gov | Request Rate Threshold Exceeded.
- 7. Elon Musk smokes marijuana live on web show. BBC News
- 8. The Great Resignation 2021: People quitting jobs in droves : Planet Money : NPR. NPR
- 9. nytimes.com. The New York Times
- 10. Search for patents | USPTO.
- 11. Drinking patterns vary by gender, age and country‐level income: Cross‐country analysis of the International Alcohol Control Study - PMC .
- 12. How The Psychology Of Income Inequality Benefits Luxury Brands.
- 13. John Paulson firm sued over Sino-Forest bet | Reuters. Reuters
- 14. It’s Time to ‘Cash In’ on Big Data | Institutional Investor. Institutional Investor
- 15. Opinion | Twelve Million Phones, One Dataset, Zero Privacy - The New York Times. The New York Times


Comments
Your email address will not be published. All fields are required.