PRTG by Paessler is recognized as a prominent network monitoring solution in the industry. Yet, with the dynamic nature of networking demands, there’s a growing need for a range of monitoring tools that cater to different scales and complexities.
We’ll cover some leading alternatives to PRTG, focusing on their key functionalities and pricing structures.
Paessler PRTG Network Monitor Alternatives
| Monitoring Tool | Device Access Control | Configuration Management | AI-Driven Analytics | Operating Systems | Price Driver | Starting Price | Free Trial |
|---|---|---|---|---|---|---|---|
| PRTG | N/A | ✅ | N/A | Windows | Node count | €1,649 | 30-days |
| Tufin | ✅ | ✅ | ✅ | Windows, Linux, others | Features | Custom | N/A |
| Auvik | N/A | N/A | ✅ | Cloud-based | Endpoint | Custom | 14-days |
| Checkmk | N/A | ✅ | N/A | Linux, Windows, others | Node count | €600 | 30-days |
| LogicMonitor | N/A | ✅ | ✅ | SaaS-based | Device count | Custom | 14-days |
| ManageEngine | ✅ | ✅ | N/A | Windows, Linux, others | Node count | Custom | 30-days |
| Nagios | N/A | N/A | N/A | Windows, Linux, others | Node count | $1,995 | Free license |
| NinjaOne | N/A | N/A | ✅ | SaaS-based | Endpoint | Custom | Available |
| SCOM | N/A | ✅ | N/A | Windows | Node count | N/A | N/A |
| SolarWinds | ✅ | ✅ | ✅ | Windows | Node count | $2,995 | 30-days |
Table notes (Vendors listed alphabetically):
- “N/A” means that specific details were not accessible or provided.
- “Configuration Management” pertains to the capability of the software to oversee and regulate the settings of network devices.
- “AI-Driven Analytics” involves using artificial intelligence to examine network-related data, enabling the prediction of potential network issues and performance metrics such as CPU or traffic usage.
- “Node count” and “Device/Endpoint count” as price drivers take into account the total number of nodes, devices, or endpoints being tracked within the network.
- “Multi-OS support” indicates the capability of a software to operate across various operating systems, such as Windows, Linux, and others.
- “SaaS-based” and “Cloud-based” refer to tools that are accessible through the internet and managed on remote servers.
Free alternatives to PRTG for network monitoring exist, but they come with their own set of challenges. Open-source options often demand significant time and effort for initial setup and ongoing customization to meet specific needs. Additionally, as your network expands, the capabilities of these free tools might not suffice, leading to gaps in your monitoring coverage.
Paessler PRTG Network Monitoring Software overview
Paessler PRTG Network Monitor serves as a network monitoring solution designed to cater a diverse range of monitoring requirements across various sectors and IT areas.
This includes overseeing expansive IT infrastructures, data centers, and elements like cloud services, databases, hardware, and network performance. PRTG’s IT monitoring solutions monitor various aspects of IT infrastructure, including local area networks (LANs), wide area networks (WANs), servers, websites, applications, devices, and network traffic.
PRTG is available in both a freeware version and commercial editions. The freeware version includes monitoring capabilities for up to 100 elements at no cost. For broader requirements, the commercial editions offer different licensing options and pricing scales.
PRTG’s pricing structure relies on the total count of sensors utilized, where typically each sensor is tasked with monitoring a single data point within the network, like a server’s CPU load or the traffic through a switch port.
The PRTG IT monitoring software lineup offers diverse solutions tailored to various infrastructure sizes and deployment preferences:
- PRTG Network Monitor: Designed for small to mid-sized setups, this tool can oversee up to 1,000 devices. It’s deployed on-premises and operates on a Windows server, with pricing based on a perpetual license model.
- PRTG Enterprise Monitor: This variant is aimed at larger infrastructures, capable of monitoring numerous distributed setups. It too is Windows-based and deployed on-premises, but differs in its pricing structure, which is subscription-based and billed annually.
- PRTG Hosted Monitor: It is suitable for smaller and medium-sized setups, similar to the Network Monitor in its capacity to monitor up to 1,000 devices, but without the need for dedicated hardware. This cloud-based option offers more flexibility with both annual and monthly subscription plans.
Key features of PRTG network monitoring tool:
- Preconfigured PRTG sensors and device templates: Preconfigured sensors are designed for plug-and-play use, enabling instant data collection and streamlining the monitoring setup for different network entities. Device templates provide a set of sensors and configurations specifically designed for certain devices, such as routers or servers, optimizing the network performance monitoring process for those particular models.
- Customizable maps and dashboards: It features an integrated map editor that enables the crafting of personalized IT infrastructure visuals using easy drag-and-drop elements. Each customized dashboard generated is accessible through a distinct URL. PRTG lacks the functionality for generating layer two maps, which are essential for visualizing physical network connections. To bridge this limitation, it’s suggested to use third-party tools like UVexplorer, capable of integrating with PRTG.

Source: Building custom network maps with PRTG1
- Customizable alerts and notifications: PRTG comes equipped with sensors that are already configured with default warning and error thresholds, but it also allows organizations to customize these thresholds according to their specific monitoring requirements.
- Bandwidth monitoring: The monitoring platform allows users to assess the bandwidth consumption of their devices and applications using various methods such as SNMP, Flow, or packet sniffing. Through SNMP, users can collect detailed data on bandwidth usage. Additionally, PRTG Maps enables the creation of visual representations and dashboards tailored to different user groups.
1. Tufin

Tufin specializes in the management of security policies, ensuring that security measures are applied across both network and cloud platforms within an organization. The company enhances network visibility and management through its Network Topology Mapper and network monitoring tools, designed to cater to the needs of extensive network infrastructures.
Leveraging Topology Intelligence, Tufin keeps track of the connectivity status throughout the network infrastructure, including firewalls, routers, and load balancers.
It monitors the configurations of network devices and notifies businesses of any significant changes that could impact network security. Tufin offers diagnostic tools that facilitate the analysis and resolution of network issues and streamline the process of troubleshooting.
2. Nagios
Nagios provides comprehensive monitoring for Linux operating systems and distributions. Among these, Nagios Core stands out as their open-source offering, enabling comprehensive IT monitoring. For more advanced needs, Nagios provides several commercial options:
- Nagios XI: Tailored for enterprise-level monitoring, this software comes with an intuitive web-based interface, visualization options, and customizable dashboards to automate network monitoring tasks.
- Nagios Fusion: This tool centralizes network monitoring, offering a centralized view of network performance to simplify network management.
- Nagios Network Analyzer: This solution provides insights into network bandwidth usage, helping to pinpoint areas of concern.
- Nagios Log Server: Designed to consolidate log data, enabling log analysis and archiving from various sources.
3. SolarWinds
SolarWinds is an observability and service management platform for hybrid and multi-cloud environments. It encompasses a broad array of management tools for networks, systems, databases, and IT services. The network management tools of SolarWinds are designed to monitor network performance, utilize topology mapping for network visualization, and address various network-related issues.
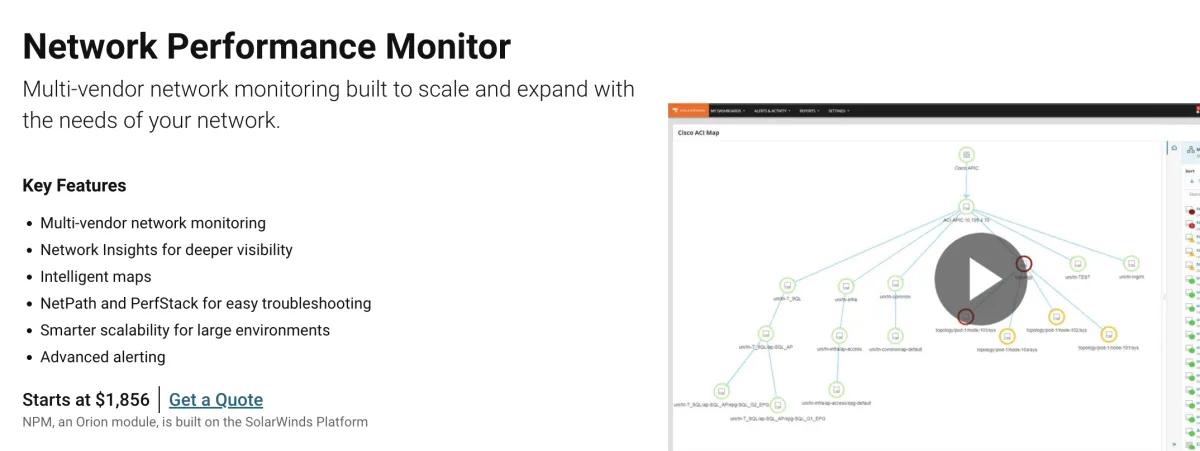
SolarWinds Network Performance Monitor (NPM) is designed to map and monitor network paths and nodes, utilizing ICMP, SNMP, and WMI protocols to ensure comprehensive network visibility.
NPM is equipped with capabilities for automatic network path and node discovery utilizing ICMP, SNMP, and WMI protocols. It also features visual mapping tools for network visualization and default network alerts to manage network performance.
Read: Top 4 Solarwinds Network Performance Monitor Competitors
4. ManageEngine

ManageEngine OpManager is a network monitoring software that offers real-time dashboards, alerts, and reports for network management. It is capable of tracking the performance of both physical and virtual servers across a variety of operating systems, including Windows, Linux, Solaris, Unix, and VMware.
OpManager’s licensing model is based on the number of devices you need to monitor. You have the flexibility to track an unlimited number of metrics or interfaces for each of these devices without affecting the license count. OpManager has the capability to analyze both the headers and content of network packets, which allows it to identify, classify, and manage specific types of network traffic.
5. LogicMonitor
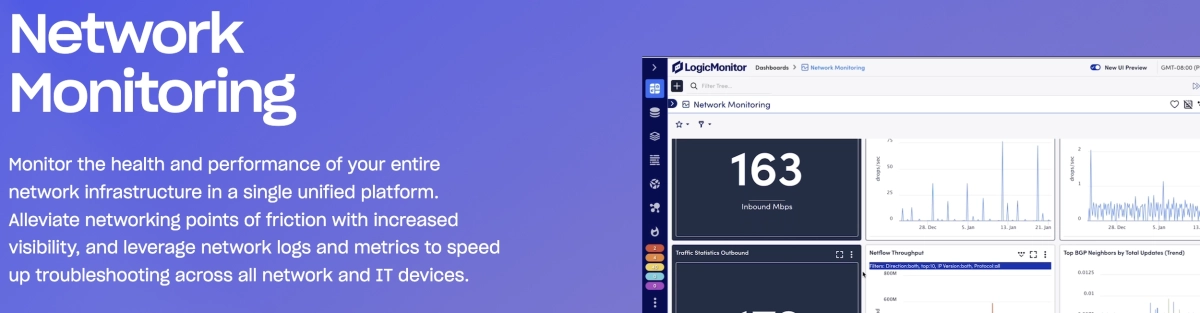
LogicMonitor offers cloud-based network monitoring, providing an infrastructure monitoring platform that includes database, storage, and server monitoring solutions. Their pricing model is determined by the number of devices monitored.
LogicMonitor’s network monitoring solution is equipped to handle both SD-WAN and cloud networks, providing capabilities such as network topology visualization, identification of underlying issues through root cause analysis, and notifications for system alert.
Read: Top 5 LogicMonitor Competitors
6. Auvik
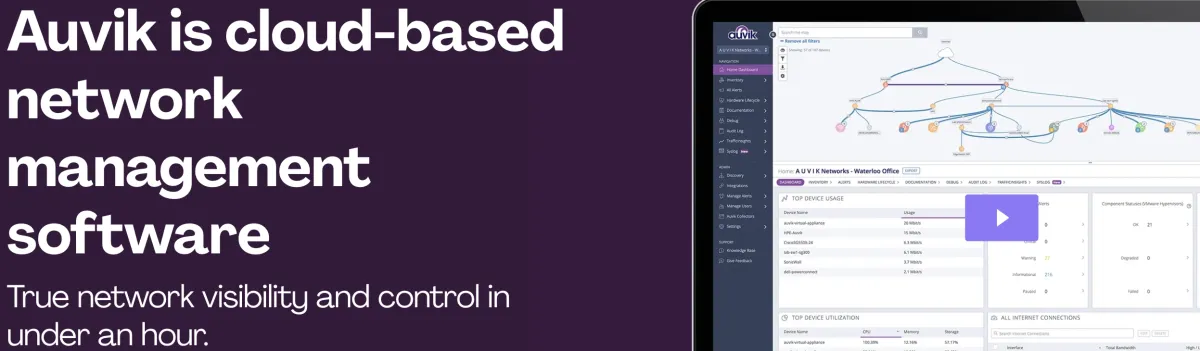
Auvik is a cloud-based platform designed to automate the tasks associated with network management and monitoring. The software provides various deployment options, including as a virtual or physical appliance, or through a lightweight Windows service.
It features automatic discovery of network elements and generates a dynamic network topology map for easy visualization. Auvik is equipped with over 50 predefined alerts that can be customized according to needs.
The network monitoring solution also tracks and documents any changes in network configurations, automatically backing up and maintaining a version history for each.
Additionally, Auvik consolidates syslog data from across the network into a single dashboard, aiding in quicker problem resolution and reducing the mean time to repair (MTTR).
7. Checkmk
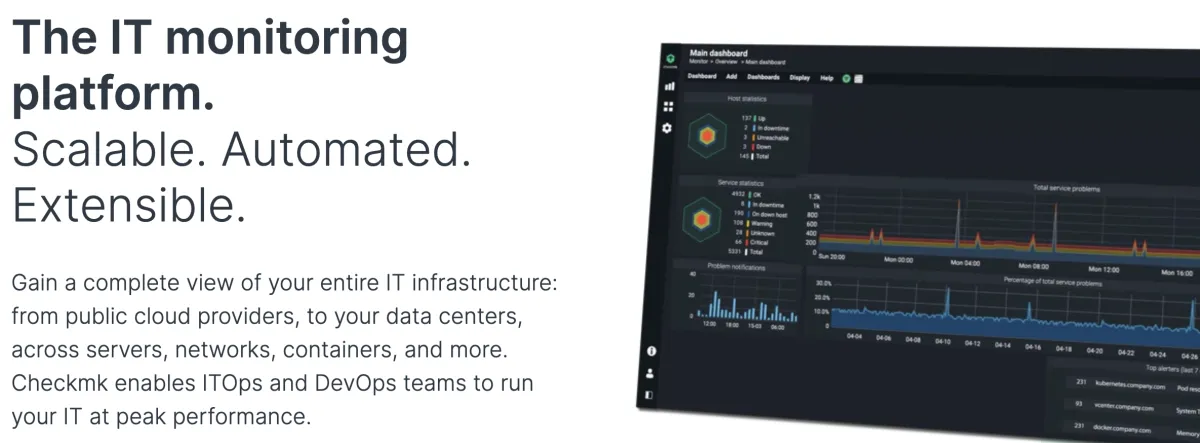
Checkmk is a network monitoring tool tailored for IT infrastructure oversight, designed to function exclusively on Linux servers. It is available in multiple versions: the Raw Edition (CRE), which is open-source; the Enterprise Edition (CEE) for more advanced monitoring features, and the Managed Services Edition (CME) geared towards service providers. Checkmk offers a 30-day trial to explore its capabilities.
Its pricing model is based on the number of devices monitored, making it adaptable to various sizes of IT infrastructures. The network monitoring software provides powerful APIs and allows for the programming of its own plug-ins or extension of existing ones.
8. SCOM
System Center Operations Manager (SCOM), a component of the Microsoft System Center product, aids organizations in simplifying the monitoring and management of enterprise IT infrastructure and applications. The network monitoring software streamlines the deployment, configuration, and oversight of an organization’s IT landscape. When SCOM detects issues within the monitored environment, it sends alerts to administrators.
SCOM incorporates role-based access control, improving operational efficiency. In terms of capacity, it’s recommended to keep application performance monitoring under 400 applications and to limit the monitoring of URLs per agent to 50 or fewer.
SCOM has specific requirements, including setting up various server roles, such as the Management Server, Gateway Server (capable of managing up to 2,000 agents), Web Console Server, and SQL Server Reporting Services server, necessitates at least 8 gigabytes of memory and 10 GB of disk space.
9. NinjaOne
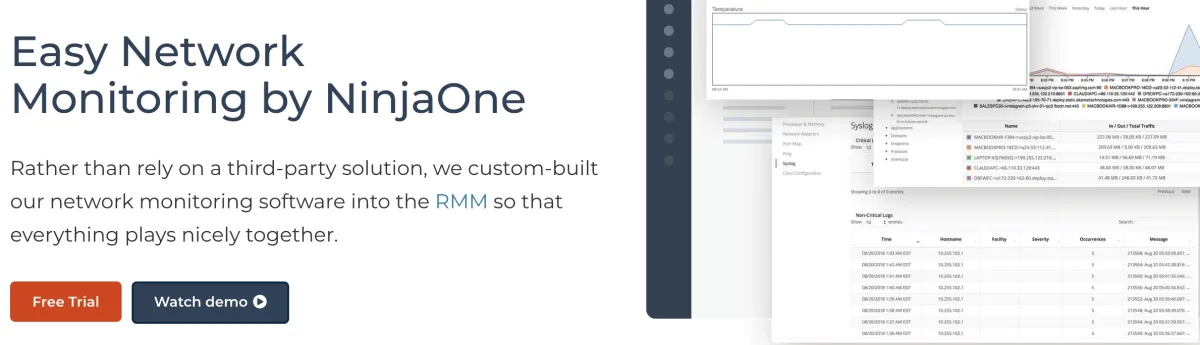
NinjaOne provides an IT management platform designed to optimize the monitoring, handling, and support within IT frameworks. Embedded within NinjaOne’s RMM (Remote Monitoring and Management) system, the network monitoring feature encompasses over 50 OID templates suitable for various device types, including Dell iDRAC, HP iLO, Synology NAS, and APC UPS units.
The platform allows for the tailoring of alerts according to type, severity, and priority, with notifications deliverable via email or SMS. It supports multiple flow data protocols like NetFlow, jFlow, sFlow, and IPFIX.
Additionally, NinjaOne features an automatic discovery function for new devices, scanning specified IP ranges. Pricing for NinjaOne’s network monitoring and management offerings is structured based on the number of endpoints monitored and the specific functionalities required by the user.
Further reading
- Network Performance Monitoring to Maximize Business Efficiency
- Top 5 Network Performance Monitoring Tools
- 10 Network Performance Best Practices to Improve Network Optimization
If you have questions or need help in finding vendors, reach out:
External Links
- 1. The magic of building individual custom network maps with PRTG. PAESSLER GmbH


Comments
Your email address will not be published. All fields are required.