Business analysts must understand the business intelligence software market trends and landscape to choose the right tools and stay competitive, data-driven, and future-ready. Follow the links to learn more on these key market drivers, challenges, and major BI tools:
- Business intelligence software market
- Enterprise cloud business intelligence software
- Open source business intelligence software
Here are top performing free and paid BI tools:
| Business Intelligence Software | Strength | |
|---|---|---|
1. | Unified governance & modular architecture via LookML modeling | |
2. | Natural language queries & AI-driven insights | |
3. | Visual-first analytics & interactive storytelling with VizQL | |
4. | Real-time data visualization & monitoring | |
5. | Embedded analytics & auto data exploration | |


Business intelligence software market: Key drivers and restraints
The global Business Intelligence (BI) software market is projected to grow from $23.1 billion in 2020 to $33.3 billion by 2025, at a CAGR of 7.6%.1

Key market drivers
This growth is driven by factors like:
- Rising data volumes: Big data stats show that the total volume of data created worldwide might reach up to 149 zettabytes by 2045. Such exponential increase in data generated by businesses has led to a greater need for efficient analysis tools to manage and extract value from this data.
- Data visualization demand: Organizations are turning to dashboards to simplify decision-making and extract actionable insights. Cloud-based tools enable scalable, cost-effective analysis.
- Digital transformation: Companies are adopting digital technologies across all areas, including business intelligence, to improve operational efficiency, enhance customer experiences, and remain competitive.
- Cloud adoption: Global cloud computing market was estimated to reach ~680 billion U.S. dollars last year, according to cloud computing stats. This shift to cloud computing allows businesses to scale their BI tools easily, access data from anywhere, and reduce costs related to on-premise infrastructure.
- Analytics investments: Organizations are increasing their investments in analytics technologies to harness big data, improve business strategies, and drive innovation.
- Crisis response due to COVID-19: The pandemic has reinforced the value of data-driven decision-making since BI tools were used to monitor pandemic data, with vendors offering dashboards for real-time insights.
Key restraints
Some of the obstacles that lower the adoption rate for BI tools in the market are detected as:
- High implementation costs: BI platforms require significant investment, which is challenging for SMEs. Cost of software, infrastructure, and skilled personnel remains a barrier.
- Prevent high costs by:
- Starting with free or low-cost tools, and running pilot projects to minimize upfront investment and training costs
- Prevent high costs by:
- ROI concerns: Justifying long-term returns on BI initiatives is difficult, especially where embedded analytics are not integrated into business workflows.
- To overcome these concerns, follow these steps:
- Identify the relevant process KPIs and set clear objectives aligned with these KPIs
- Measure the impact of BI initiatives on them over time
- Use the results to demonstrate tangible business value.
- To overcome these concerns, follow these steps:
- Data integration: Integrating cloud BI with existing on-premises systems remains a major technical challenge, especially in complex IT environments.
- Use modern data integration tools that standardize formats, break down silos, and provide scalable, secure pipelines.
- Data security risks: BI platforms handle large amounts of sensitive data, making them targets for cyberattacks. Vulnerabilities like weak access controls, insecure integrations, and third-party risks can lead to data breaches, loss, or regulatory non-compliance (e.g., GDPR).
- Overcome these risks by:
- Implementing data governance tools
- Enforcing role-based access controls
- Using data encryption
- Applying multi-factor authentication
- Securing APIs
- Continuously monitoring and data masking
- Leveraging other privacy enhancing technologies.
- Overcome these risks by:
Business intelligence (BI) software
Business intelligence (BI) platforms help organizations understand, analyze, and share their data. Enabled by IT and enhanced by AI, these platforms allow users to:
- Explore key data dimensions (e.g., product, customer, time, geography)
- Ask business-critical questions (e.g., which customers might churn?)
- Create and track performance metrics (e.g., delivery times, workplace incidents, satisfaction scores)
- Combine structured and unstructured data to uncover insights, anomalies, and trends
ABI platforms make it possible to build flexible data pipelines and gain actionable intelligence. Here are their core and additional functionalities:
| Feature | Definition | Feature type |
|---|---|---|
| Data visualization | Interactive dashboards that allow users to explore data visually by manipulating charts. | Core feature |
| Governance | Tools to control access, track usage, and manage secure data sharing and promotion. | Core feature |
| Reporting | Pixel-perfect, paginated reports that can be scheduled and distributed to large user groups. | Core feature |
| Analytics catalog | A searchable catalog that displays and recommends analytics content for easy discovery. | Core feature |
| Data preparation | Drag-and-drop interface for combining data from multiple sources and building analytic models (e.g., custom measures and hierarchies). | Core feature |
| Data science integration | Tools for developing and prototyping machine learning models, accessible to both citizen and professional data scientists. | Core feature |
| Automated insights | ML-generated insights that highlight key data attributes without manual analysis. | Common feature |
| Metrics layer | A virtual layer for defining, governing, and sharing business metrics across analytics and applications. | Common feature |
| Data storytelling | Combines visuals and narratives to communicate insights clearly to decision-makers. | Common feature |
| Natural Language Query (NLQ) | Lets users query data using natural language, either typed or spoken. | Common feature |
| Collaboration | Supports co-creation of analytics projects among diverse users. | Common feature |
| Composability | Allows integration of analytics into applications using low/no-code tools, APIs, and SDKs, often supported by generative AI. | Common feature |
BI software market overview
The BI software market is evolving across multiple dimensions. Key segmentation highlights include:
- Deployment:
- Cloud BI is favored by startups and SMEs for flexibility and cost-efficiency by 2023..
- On-premise BI is gaining traction among large enterprises needing control and compliance.
- Enterprise size:
- Large enterprises focus on advanced analytics capabilities in the BI market since 2023.
- SMEs are the fastest-growing client type (2024–2034), thanks to scalable cloud solutions.
- Payment model:
- Market split between open-source and commercial (subscription-based) tools, catering to diverse budgets.
Based on these segments above, we observed that nearly all tools offer cloud deployment options and cater to both enterprises and SMEs. Therefore, we categorized the tools by payment model:
- Enterprise cloud BI software, which are primarily commercial solutions
- Open-source BI software, which includes fully open-source frameworks as well as proprietary platforms with free community editions.
Enterprise Cloud Business intelligence software
Here is a list of commercial BI tools and their pricing models, ranked based on their ratings from a B2B user review platform:
| BI Tool | Rating | Pricing | Free Trial |
|---|---|---|---|
| Google Looker | 4.4 based on 1,602 reviews | Custom Pricing | ❌ |
| Microsoft Power BI | 4.4 based on 1,514 reviews | Free Pro: $14.00/user/month Premium: $24.00/user/month Embedded: Custom pricing | ✅ |
| Sisense | 4.3 based on 1,275 reviews | Custom Pricing | ✅ |
| Qlik Sense | 4.3 based on 1,236 reviews | Starter: $200/mo (for 10 users) Standard: $825/mo (for 25 GB data) Premium: $2,750/mo (for 50 GB data) Enterprise: Custom pricing | ✅ |
| Tableau | 4.4 based on 1,188 reviews | Enterprise Viewer: $35/user/month Enterprise Explorer: $70/user/month Enterprise Creator: $115/user/month | ✅ |
| Domo | 4.4 based on 1,162 reviews | Custom Pricing | ❌ |
| IBM Cognos Analytics | 4.1 based on 961 reviews | Standard: $10.60/user/month Premium: $42.40/user/month | ❌ |
| Zoho Analytics | 4.2 based on 793 reviews | Basic: €24/month Standard: €48/month Premium: €115/month Enterprise: €455/month Custom: Custom pricing | ✅ |
| MicroStrategy | 3.9 based on 788 reviews | Custom Pricing | ✅ |
| TIBCO Spotfire | 4.2 based on 671 reviews | Custom Pricing | ✅ |
| SAP Analytics Cloud | 4.3 based on 615 reviews | BI Public: $324 per user/year BI Standard: $912 per user/year BI Professional: $10,260 per user/year | ✅ |
| Board International | 4.4 based on 503 reviews | Custom Pricing | ❌ |
| SAP BusinessObjects | 4.0 based on 430 reviews | Custom Pricing | ❌ |
| GoodData | 4.2 based on 426 reviews | Custom Pricing | ✅ |
| ThoughtSpot | 4.4 based on 345 reviews | Essentials: $1,250/month for 20 users Pro: Custom pricing Enterprise: Custom pricing | ✅ |
| Oracle Analytics | 4.1 based on 284 reviews | Professional: $16/user/month Enterprise: $80/user/month | ✅ |
| SAS Viya | 4.3 based on 283 reviews | Custom Pricing | ✅ |
| Amazon QuickSight | 4.2 based on 281 reviews | Author: $24/user/month Author Pro: $50/user/month Reader: $3/user/month Reader Pro: $20/user/month Capacity pricing: $250 for 500 sessions /month | ✅ |
| Pentaho | 4.2 based on 215 reviews | Custom Pricing | ❌ |
| Yellowfin | 4.1 based on 150 reviews | Custom Pricing | ✅ |
| SAS Business Intelligence | 4.3 based on 110 reviews | Custom Pricing | ✅ |
| TARGIT | 4.1 based on 67 reviews | Custom Pricing | ✅ |
| TIBCO Jaspersoft | 4.2 based on 59 reviews | Custom Pricing | ✅ |
| Incorta | 4.5 based on 54 reviews | Custom Pricing | ❌ |
| Oracle BI (Publisher) | 4.1 based on 29 reviews | Custom Pricing | ✅ |
| Pyramid Analytics | 4.1 based on 24 reviews | Custom Pricing | ✅ |
| Alibaba Quick BI | 4.3 based on 8 | Personal Version: $1/year Custom Pricing | ✅ |
| Infor d/EPM | 4.0 based on 1 reviews | Custom Pricing | ❌ |
| Tellius | 5.0 based on 1 reviews | Premium: $1,495/month for up to 10 users Enterprise: Customized pricing for unlimited users | ✅ |
Google Looker
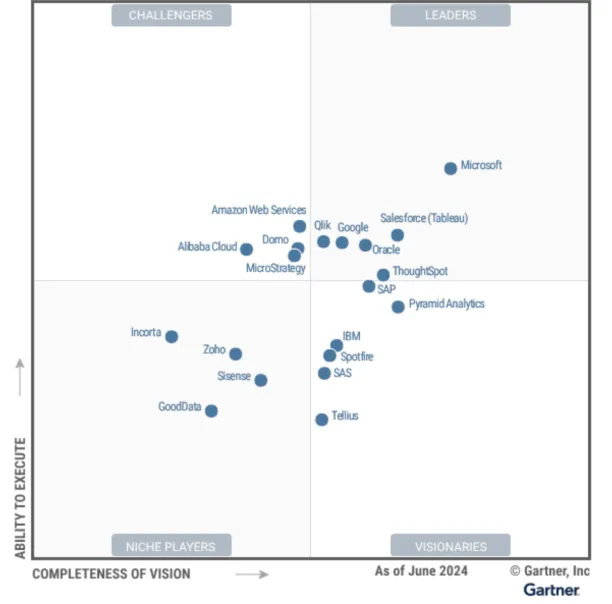
Google is a Leader in this Magic Quadrant. Looker, its ABI platform, offers multicloud deployment, governed analytics, and a semantic modeling layer via LookML. Looker Studio, formerly Data Studio, operates as a free standalone product or can integrate with Looker for combined access to governed and ungoverned data.
In 2023, Google integrated Looker Studio with Looker’s semantic layer to create a unified platform for production-grade reports, self-service dashboards, and developer-built analytics content.
Pros
- Unified governance with LookML and Looker Studio integration.
- Modular architecture to enable headless BI and integration with open-source tools and other BI platforms.
Cons
- Limited visual data preparation, leading business users to rely on Looker Studio Pro for self-service capabilities.
- Additional configurations and Google tools may be required to automated insights since these cannot be natively embedded.
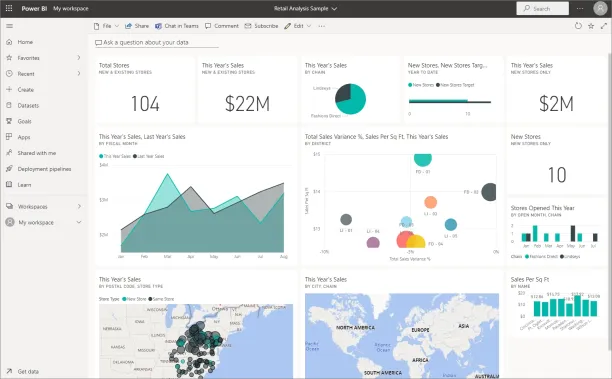
Microsoft PowerBI
Microsoft remains a Leader in the ABI market, primarily due to the widespread adoption of Power BI, which benefits from integration across the Microsoft ecosystem. Its product strategy ties closely with Azure and Microsoft 365, and its continuous expansion of AI features aligns with enterprise cloud and productivity trends.
Pros
- Broad user base supported by Power BI’s bundling with Microsoft 365 and Azure.
- Strong integration with Azure services, including Azure ML and Microsoft Fabric.
- Capabilities for data prep, visualization, and natural language querying.
Cons
- Performance limitations when dealing with large data volumes or complex models.
- Dependency on Microsoft’s ecosystem may limit flexibility for multi-cloud strategies.
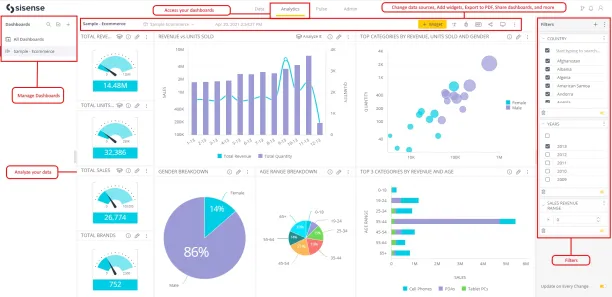
Sisense
Sisense offers a hybrid cloud solution with a focus on embedded analytics and self-service. The Fusion platform continues to evolve, with composability and AI-driven development tools like the Compose SDK. Sisense emphasizes DevOps principles for seamless integration of analytics into business applications.
Pros
- DevOps integration for seamless analytics deployment
- Advanced analytics discoverability for self-service and pro users.
Cons
- Limited accessibility of metrics layer outside Sisense ecosystem
- Lack of a data or application ecosystem for competitive advantage
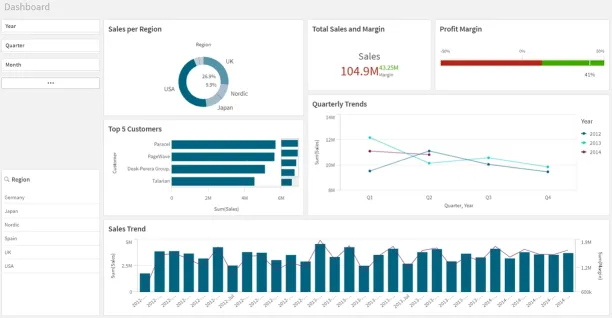
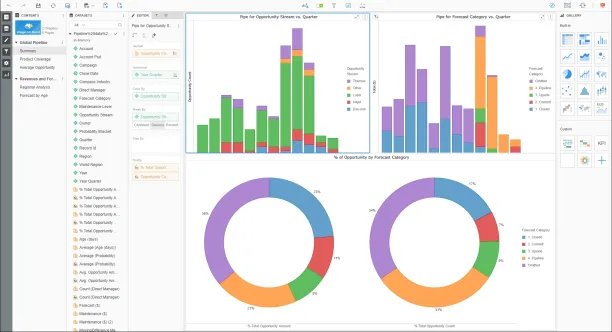
Qlik Sense
Qlik Cloud Analytics is offered as a SaaS platform, featuring Qlik Sense, Qlik AutoML, and Qlik Application Automation. Acquisitions like Talend and Attunity have made Qlik a strong player in data integration. In 2023, Qlik launched Qlik Staige, a platform combining data automation and AI analytics. In addition, Qlik expanded integrations with Microsoft Teams, AWS Bedrock, and acquired Kyndi for generative AI.
Pros
- Cloud-agnostic nature to work across all major platforms
- Data and analytics capabilities, including data integrations, LLM integration, and data-to-decision workflow for enterprise developers.
Cons
- Lack of own cloud infrastructure or business applications
- Limited vertical-specific solutions to meet the data analysis and reporting needs of any specific industry.
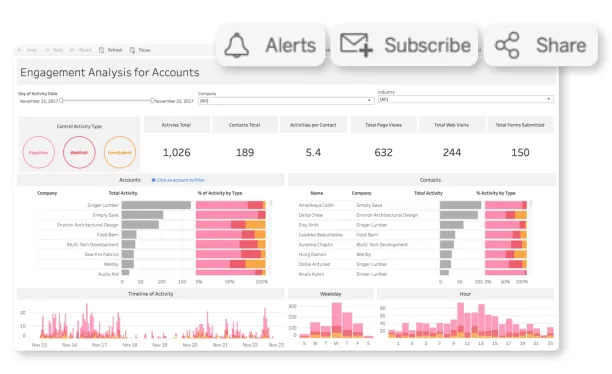
Salesforce Tableau
Tableau, a Salesforce company, focuses on visual analytics, allowing users to explore data and gain insights easily. In 2023, Tableau introduced Tableau Pulse for augmented analytics. It has enhanced embedded analytics with a usage-based pricing model. Tableau has a dedicated leadership team, which reflects its strategic significance within Salesforce.
Pros
- Composability with VizQL and position in the visual analytics.
- Consumption-based pricing
- Data blending and storytelling ease by combine data from multiple sources without heavy prep or modeling and presenting insights with an interactive narrative.
Cons
- Pricing structure for embedded analytics capabilities may be complicated to handle for new starters.
- Complex product suites, especially expanded product suite can overwhelm clients.
Domo
Domo offers a full-stack solution from data ingestion to BI and app development, supported by over 1,000 native connectors. It has a strong presence in marketing analytics and among SMBs with limited data warehousing.
Pros
- Serves both analysts and data scientists; Magic ETL simplifies data preparation, and low-code tools support workflow integration and scenario modeling.
- Supports third-party AI models and enables deployment across ETL, applications, and workflows using Jupyter and AutoML.
- Introduced a credit-based pricing model that promotes platform access and experimentation without per-user limits.
Cons
- Lacks the ecosystem leverage of vendors tied to large cloud or enterprise software platforms.
- Geographic footprint is limited; local support and billing options are only available in a few countries.
- NLQ features are recent additions and still behind competitors in augmented analytics capabilities.
IBM Cognos Analytics
IBM Cognos Analytics supports a broad range of users and offers rich visuals, enterprise reporting, smart recommendations, and predictive analytics. In 2023, it enhanced support for combining BI with predictive workloads, enabling both analysts and data scientists to explore and model data.
Pros
- Centralized analytic content via the IBM Analytics Content Hub supports diverse user roles.
- Enterprise reporting features, including custom layouts and complex logic.
- Decision intelligence vision with planning and optimization tools integrated into the platform.
Cons
- Vendor locking for SaS, trailing in growth and technical capabilities compared to other major clouds.
- Limited market traction due to lack of integration with mainstream productivity or enterprise software suites
- Weaker in business analysis, such as data preparation.
Zoho Analytics
Zoho Analytics is designed for business analysts, offering tools for data visualization, preparation, and analytics app development. In 2023, Zoho incorporated OpenAI’s generative AI for new features and introduced Code Studio for professional coding environments. It also integrates with third-party ABI tools, providing a unified interface.
Pros
- Prebuilt reports with a broad library of industry-specific reports and dashboards.
- Integration for easy integration with other ABI tools, creating a unified analytics experience.
Cons
- Limited features for data scientists, like less advanced data science and ML capabilities compared to some other platforms.
- Challenges with global support and regional services.
MicroStrategy
MicroStrategy focuses on scalability, governance, and enterprise-grade BI, with support for cloud and on-premise deployments. Its platform offers tools for both code-first and low-code development and recently added AI-driven features like Auto and HyperIntelligence enhancements.
Pros
- Governed metrics with semantic graph and centralized architecture.
- Expanded AI capabilities, including natural language querying and code generation.
Cons
- Steep learning curve for new users and limited ease-of-use feedback from customers.
- Complex architecture may require substantial IT involvement.
TIBCO Spotfire
Spotfire integrates visual analytics with data science and in-line data wrangling. It allows for the analysis of both at-rest and streaming data. In 2023, Spotfire introduced a generative AI chatbot for product help, customer document handling, code generation, auto-visualization, and data interrogation in natural language. Over 200 Python functions were made open-source, targeting industry-specific use cases such as time series and ML pipelines.
Pros
- Industry-Specific Applications: The platform includes prebuilt solution accelerators for industries like healthcare, energy, and supply chain.
- Multipersona Usage: It serves business analysts with interactive visualizations and data prep features, while also supporting data scientists and citizen data scientists with R and Python functions and model-building capabilities.
Cons
- Vertical focus: Spotfire is mainly used in life sciences, energy, and high-tech manufacturing, which may limit support for other industries.
- Complexity: The platform may require technical expertise, especially in statistics and advanced analytics, to fully leverage its features.
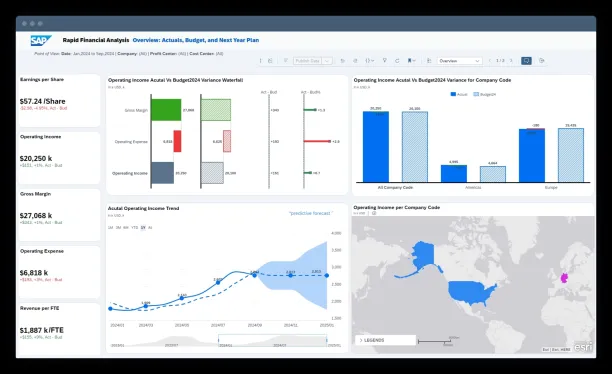
SAP Analytics Cloud
SAP Analytics Cloud (SAC) is a multi-tenant cloud platform providing data visualization, reporting, and augmented analytics. With SAP Datasphere, it has bolstered its data ecosystem, integrating well with SAP’s enterprise applications. SAC’s focus is on decision-centric analytics, covering planning, forecasting, and simulation.
Pros
- Integrations with SAP applications (e.g., S/4HANA, SuccessFactors)
- Decision-centric analytics for business planning and forecasting
- Pre-built accelerators and templates for SAP business apps
- Strong capabilities in unified cloud data integration.
Cons
- Vendor lock-in due to limit appeal outside the SAP ecosystem
- Limited deployment options with public cloud-only deployment approach.
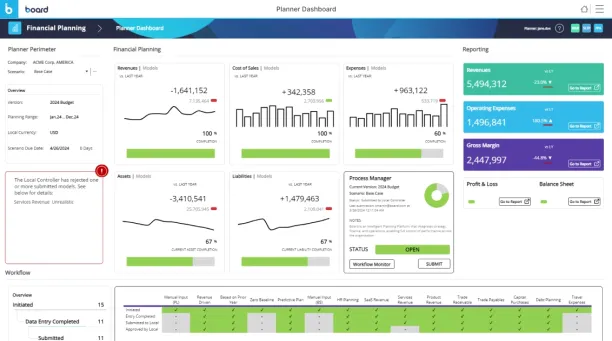
Board International
Board International is a Swiss-based software company offering an all-in-one platform that combines business intelligence (BI), corporate performance management (CPM), and predictive analytics. Designed for enterprises, it enables users to perform data analysis, budgeting, forecasting, and reporting within a unified, no-code environment.
Pros
- Integrated BI and CPM functionalities streamline decision-making processes.
- User interface that is user-friendly and no-code to facilitate rapid deployment.
Cons
- Initial setup can be complex and time-consuming.
- Data retention can be challenging due to limited native connectors for certain data sources, requiring dditional integration efforts.
- Learning curve can be high for advanced features that may necessitate training for optimal utilization.
SAP BusinessObjects
SAP BusinessObjects is an enterprise-grade business intelligence (BI) platform that provides comprehensive reporting, ad-hoc analysis, and data visualization tools. It enables organizations to access real-time data, generate interactive dashboards, and perform in-depth analytics, facilitating informed decision-making across various business functions.
Pros
- Reporting and scheduling capabilities
- Integration with SAP ERP systems for consistent data flow
- Self-service BI with intuitive tools for data analysis.
Cons
- Learning curve can be high due to complex user interface.
- Limited dashboarding capabilities compared to some modern BI tools.
- Resource- intensive implementation and maintenance
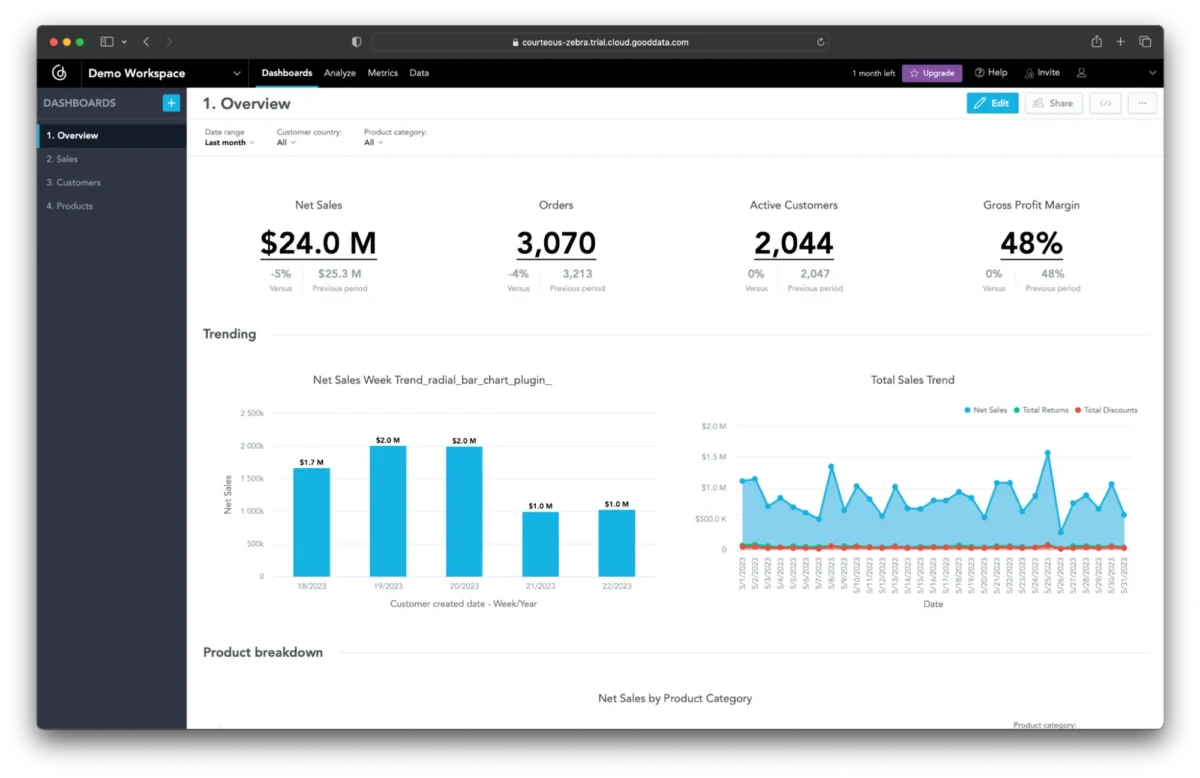
GoodData
GoodData focuses on composable BI with a headless architecture, aimed at organizations adopting DevOps practices. Its analytics-as-code approach and API-driven model are designed for custom integration and metric standardization. It offers GoodData Cloud Native (for cloud and on-premise deployments) and GoodData Cloud (SaaS), both of which saw enhancements in 2023.
Pros
- Centralized metric stores for consistency, with integrations for data pipelines and third-party BI tools.
- Composability and lifecycle alignment with application development.
Cons
- Implementation challenges due to data governance and engineering maturity.
- Weaker support for conventional ABI scenarios compared to traditional platforms.
ThoughtSpot
ThoughtSpot offers augmented analytics with capabilities for data exploration, insights generation, and integration into data stacks. It acquired Mode Analytics in 2023, expanding its tools for technical data analysts. ThoughtSpot also introduced a generative AI conversational analytics interface, Sage, and improved its SpotIQ feature for automated insights.
Pros
- Generative analytics based on AI models like GPT-4 for personalized insights, enhancing its augmented analytics and data storytelling features.
- Customizable development by delivering its APIs and SDKs for building custom analytics applications.
- Customer deployment success due to its implementation support.
Cons
- Ecosystem limitations since the platform lacks a comprehensive ecosystem compared to larger competitors, which may limit its appeal to enterprises seeking integrated solutions.
- Data science features are not as developed as other platforms despite the strong analytics features.
Oracle Analytics Cloud
Oracle offers Oracle Analytics Cloud (OAC) and Oracle Analytics Server (OAS) for hybrid deployments. Its strategy emphasizes alignment with Oracle’s data stack and investment in generative AI for data analysis.
Pros
- Integration with Oracle Cloud Infrastructure and database ecosystem.
- AI capabilities such as AI-assisted data preparation, natural language querying, and AutoML capabilities.
- Support for semantic model management and data lineage.
Cons
- Vendor lock-in as the user adoption outside Oracle-centric environments remains weak.
- Limited differentiation in visualization and dashboard interactivity.
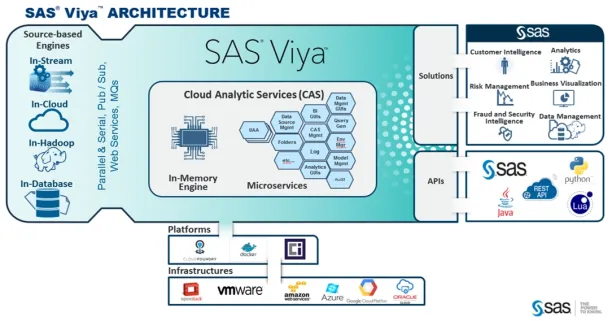
SAS Viya
SAS offers SAS Visual Analytics as part of its SAS Viya portfolio. SAS has focused on improving Viya’s cloud capabilities, AI/ML workflows, and collaboration features. Its open architecture supports various languages and enhances the user experience across the D&A lifecycle.
Pros
- AI and ML driven analytics automation capabilities
- Collaboration across the D&A ecosystem
Cons
- Limited integration outside Microsoft 365 ecosystem
- Cloud challenges regarding cloud-native transition and competition from other cloud services.
Amazon QuickSight
AWS is a Challenger, with Amazon QuickSight primarily adopted by users of the AWS ecosystem. Users highlight its integration with AWS data services, performance, and pricing model.
AWS extended its NLQ tool, Amazon Q, with LLM capabilities to support dashboard building, calculations, and auto-generated summaries. These data stories are kept within QuickSight to maintain governance. AWS also improved integration with forecasting tools.
Pros
- Deep integration with the AWS platform enables seamless use with services like Redshift and Athena.
- Serverless architecture that allows dynamic scaling without manual infrastructure management.
Cons
- Availability issues on -premises or in multi-cloud/private cloud setups since QuickSight is restricted to AWS deployments.
- Separate licensing and manual setup for governance features may require additional AWS tools (e.g., DataZone, CloudTrail, CloudWatch).
- Lack of built-in data preparation tools since it relies on AWS Glue services for ETL tasks.
Open source business intelligence software
Open-source business intelligence tools range from dedicated BI platforms to more general-purpose frameworks that are also useful for data analysis and reporting.
Below is a list of free and open-source BI tools, sorted by their number of GitHub stars:
| BI Tool | Type | GitHub Stars | Core functionality | Notes |
|---|---|---|---|---|
| Grafana | Fully Open Source | 67.6k | Data Visualization & Monitoring | Primarily used for real-time data visualization and monitoring; not a full-fledged BI tool. |
| Apache Superset | Open source | 65.9k | Data Exploration & Visualization | A modern data exploration and visualization platform under the Apache License 2.0. |
| Metabase | Commercial with Community Edition | 41.7k | BI tool | Offers a free, open-source version for self-hosting, alongside paid enterprise and cloud-hosted options. |
| Redash | Commercial with Community Edition | 27.2k | Data Querying & Visualization | Open-source platform for data visualization and collaboration. |
| DataEase | Fully Open Source | 20k | BI tool | Offers reporting, dashboards, and data analysis capabilities. |
| Virgilio | Fully Open Source | 14.1k | Data Science Tutorial Platform | Serves as a knowledge-sharing platform for data science tutorials; not a BI tool. |
| dbt-core | Fully Open Source | 10.7k | Data Transformation (ELT) | Focuses on transforming data within data warehouses using SQL; not a complete BI solution. |
| Wren AI | Open source | 7.6k | AI-Powered Data Analysis | An open-source AI assistant for data analysis. |
| Openblocks | Fully Open Source | 6k | Application Development Platform | Provides a low-code platform for building internal tools; not specifically a BI tool. |
| Evidence | Open source | 5.1k | Markdown-Based Reporting | An open-source business intelligence tool built on Markdown and SQL. |
| Blazer | Open source | 4.6k | SQL-Based Reporting | An open-source business intelligence dashboard for Rails applications. |
| Lightdash | Open source | 4.6k | BI tool | An open-source BI tool that integrates with dbt. |
| Briefer | Fully Open Source | 4k | Data Reporting | Offers simple data reporting features; limited BI functionalities. |
| CBoard | Fully Open Source | 3.1k | BI tool | Provides reporting, dashboards, and data analysis features. |
| Quary | Open source | 2.3k | Data Exploration & Visualization | An open-source data exploration and visualization tool. |
| Tabix | Open source | 2.2k | ClickHouse GUI | An open-source interface for ClickHouse and other databases. |
| awesome-business-intelligence | Open source | 2.2k | Curated Tool List | A curated list of open-source business intelligence tools. |
| poli | Open source | 2k | BI tool | An open-source BI server with a user-friendly interface. |
| pretzelai | Fully Open Source | 2.1k | AI-Powered Data Analysis | Utilizes AI for data insights; limited traditional BI components. |
| datart | Fully Open Source | 2.1k | BI tool | Offers data visualization, dashboards, and reporting features. |
| Seal Report & ETL | Open source | 1.5k | Reporting & ETL | Open-source reporting tool for the .NET framework. |
| Jaspersoft Community Edition | Commercial with Community Edition | 1.1k | BI tool | Provides a free, open-source community edition alongside commercial offerings. |
| BIRT (Eclipse) | Open source | 484 | Reporting Engine | An open-source reporting system integrated with the Eclipse platform. |
| Pentaho developer edition | Commercial with Community Edition | 477 | BI tool | Offers a free developer edition under LGPL, with enterprise features available in commercial versions. |
| Knowage Server | Open source | 419 | BI tool | A professional open-source suite for business analytics. |
| Lumify | Open source | 417 | Data Fusion & Visualization | An open-source big data analysis and visualization platform. |
| Helical Insight Community Edition | Commercial with Community Edition | 308 | BI tool | Provides a free, open-source community edition with limited functionality; enterprise features require a commercial license. |
| KNIME Analytics Platform | Open source | 181 | BI tool | A free and open-source platform for data analytics. |
| ReportServer Community Edition | Commercial with Community Edition | 50 | BI tool | Offers a free community edition under AGPL, with additional features in the enterprise edition. |
| FineReport | Commercial with Free Version | 20 | Reporting & Dashboards | Free for personal use without time or function limits; commercial licenses available for enterprise use. |
| SQL Power Wabit | Open source | 20 | Reporting Tool | An open-source BI reporting tool. |
| Preset Cloud | Commercial with Open-Source Core | 16 | Data Exploration & Visualization | A managed service built on Apache Superset, offering enterprise features. |
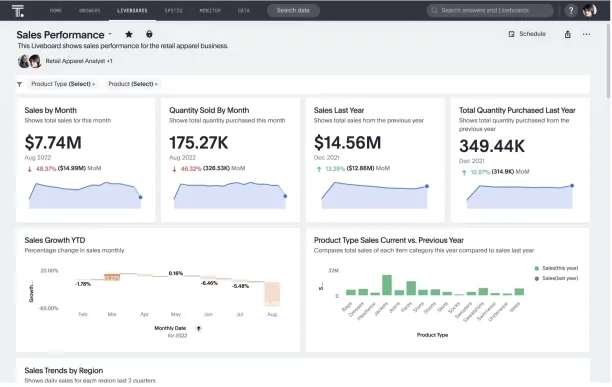
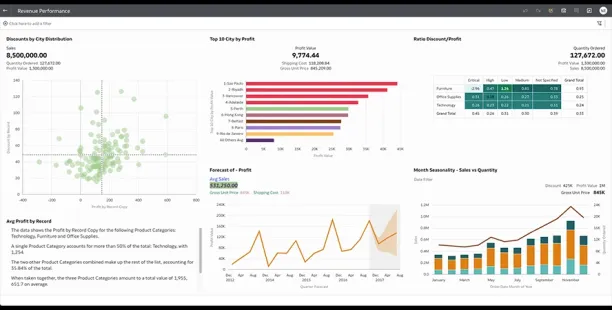
BI tools for data visualization
BI tools transform raw data into clear, visual stories. They connect to various data sources (.e.g spreadsheets, databases, or cloud apps) and convert complex numbers into interactive charts, graphs, and dashboards.
This visual approach helps users quickly identify trends, spot anomalies, and make informed decisions without needing advanced technical skills. By simplifying data interpretation, BI tools empower teams to act on insights efficiently.
Further reading
Explore more on business intelligence related tools and solutions:
- What is Process Intelligence & 5 Reasons Why It Matters
- 12 Ecommerce Market Intelligence Best Practices
FAQs
What is the size of the B2B software market?
The B2B SaaS market was valued at approximately USD 461.77 billion in 2024 and is projected to reach USD 1,819.87 billion by 2033, growing at a CAGR of 18.7% .Business Research Insights
How big is the business analytics software market?
The business analytics software market was valued at USD 394.55 billion in 2024 and is projected to grow to USD 1,447.62 billion by 2034, exhibiting a CAGR of 13.88% .
Is business intelligence in high demand?
Yes, the global business intelligence software market was valued at USD 41.74 billion in 2024 and is expected to surpass USD 151.26 billion by 2034, growing at a CAGR of 13.74% .Precedence Research
What is the business intelligence market?
The business intelligence market encompasses software and services that enable organizations to collect, analyze, and visualize data to support informed decision-making. This includes tools for data mining, reporting, performance benchmarking, and predictive analytics.
External Links
- 1. Business Intelligence Market Growth Drivers & Opportunities | MarketsandMarkets. MarketsandMarkets
- 2. Source 1
- 3. Einführung in Dashboardkacheln für Power BI-Designer - Power BI | Microsoft Learn.
- 4. Introduction to Dashboards.
- 5. Introduction to Dashboards.
- 6. Tableau Cloud | Schnelle, flexible und benutzerfreundliche Analytics in der Cloud.
- 7. Introduction to Dashboards.
- 8. What are Business Intelligence Dashboards? Examples & Best Practices - Zoho Analytics.
- 9. Introduction to Dashboards.
- 10. Introduction to Dashboards.
- 11. Introduction to Dashboards.
- 12. Introduction to Dashboards.
- 13. Create Dashboards | GoodData Cloud.
- 14. Create Dashboards | GoodData Cloud.
- 15. Create Dashboards | GoodData Cloud.
- 16. Create Dashboards | GoodData Cloud.


Comments
Your email address will not be published. All fields are required.