

As IT automation trends continue to shape the industry, AIOps or MLOps tools are becoming increasingly essential for IT teams, 40% in DevOps pipelines alone. Despite the increasing attention to AIOps technology, business leaders and IT analysts may find it hard to choose the right tool that perfectly aligns with their needs.
In this article, we will comprehensively compare various AIOps tools, shedding light on their features, capabilities, and how they can enhance IT operations and decision-making processes. By exploring these key factors, we aim to assist businesses in making informed decisions and unlocking the full potential of AIOps to drive efficiency and agility in their IT environments.
15 best AIOps platforms
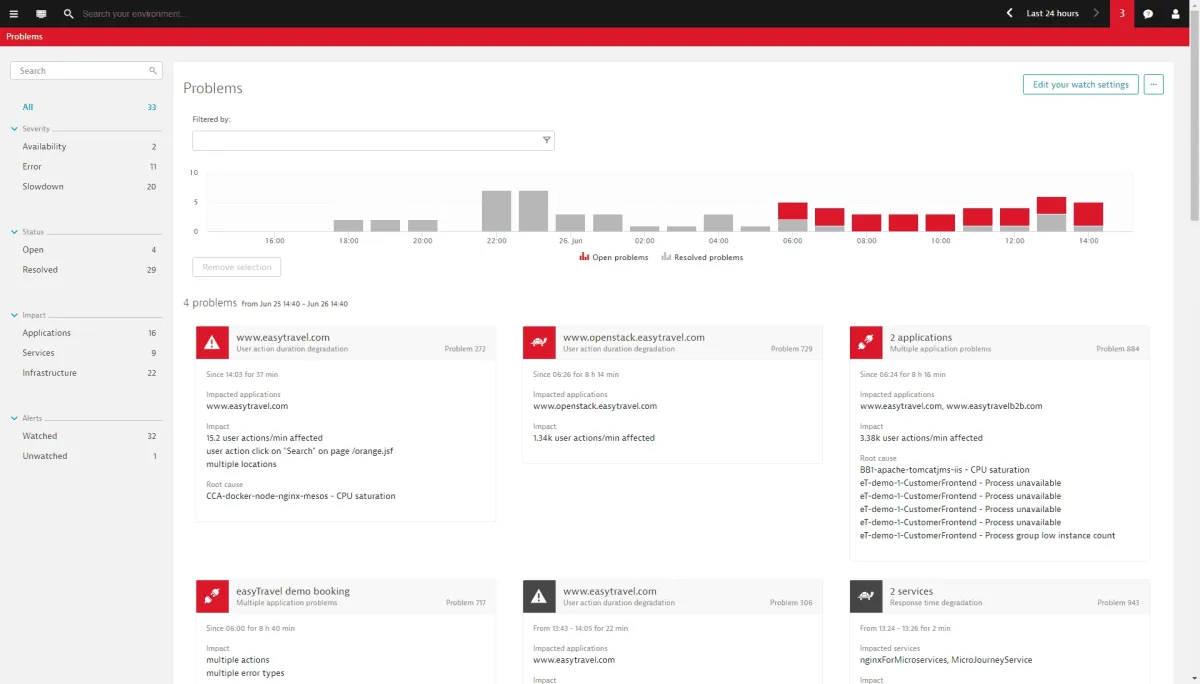
The cover image depicts the total number of B2B reviews for all AIOPs solutions on major B2B review platforms (G2 and TrustRadius). The table below includes information regarding free trial offer, average scores obtained from these review platforms, and Pros and cons for each tool. The tools are sorted in alphabetical order.
| AIOPs platforms | Free trial | Average Scores |
|---|---|---|
| BigPanda | ❌ | 4.47 |
| Datadog | ✅ | 4.28 |
| Dynatrace | ❌ | 4.33 |
| IBM Instana | ✅ | 4.50 |
| LogicMonitor | ✅ | 4.33 |
| ManageEngine OpManager | ✅ | 4.32 |
| MicroFocus OpsBridge | ❌ | 4.37 |
| Moogsoft | ✅ | 4.45 |
| Netreo | ❌ | 4.50 |
| New Relic One | ❌ | 4.30 |
| PagerDuty | ✅ | 4.48 |
| Sematext Cloud | ✅ | 4.70 |
| Splunk Enterprise | ✅ | 4.27 |
| Zenoss Cloud | ❌ | 3.97 |
1) AppDynamics
It is a performance monitoring and analysis tool offering real-time insights into application performance, user experience, cloud driven data management, and infrastructure monitoring.
AppDynamics utilizes specific modules, including Application Performance Monitoring, Infrastructure Monitoring, Business Performance Monitoring, End User Monitoring, and Database Monitoring. Through these modules, AppDynamics helps track and visualize customer journeys.
2) BigPanda
Big Panda is an event correlation and automation platform driven by AIOps. It excels in collecting data from diverse sources, such as tools and technologies, change management, and orchestration, and then consolidating it into a single, unified Open Hub.
3) Datadog
This cloud-based data management and monitoring platform is designed to serve IT teams, developers, and security engineers. Datadog offers a Watchdog module that serves as both a root cause analysis tool and a system assistant.
In addition to application performance management (APM), Datadog includes features for security, log management, network monitoring, and real-user monitoring.
4) Dynatrace
Dynatrace is an intelligent APM platform empowered by artificial intelligence used by AIOps, offering a range of modern IT services. These services encompass automation, infrastructure, cloud monitoring, and digital experience monitoring.
The platform enables comprehensive monitoring of the entire IT infrastructure, covering the network, processes, and hosts. It also offers functionalities for log monitoring, information viewing, and deep data insights. Additionally, Dynatrace delivers valuable insights to aid with performance optimization and issue resolution.
5) IBM Instana
Instana, now a core component of IBM’s AIOps portfolio, serves as a comprehensive full-stack observability platform. With full stack monitoring capabilities and a focus on enhancing application performance monitoring (APM), it is tailored specifically for cloud-native and microservices applications. Instana excels at automating and expediting CI/CD platforms, regardless of the application’s deployment location.
The platform gathers performance data driven by observability from diverse cloud environments, offering AI-driven root cause analysis, and subsequently provides actionable insights through automation.
6) LogicMonitor
A SaaS-based monitoring platform for infrastructure and networks, ensuring reliable business performance monitoring and availability. With AI integrated into its IT operation management, the platform achieves substantial process automation, establishing itself as a noteworthy AIOps solution.
7) ManageEngine OpManager
OpManager is an integrated solution to monitor and manage various aspects of IT infrastructure. OpManager’s capabilities include:
- Monitoring over 1000 devices, such as networks, servers, IP addresses, and switch ports
- Managing bandwidth, network configurations, firewall rules, logs, policies, application usage, and storage devices.
- Tracking more than 100 physical and virtual server performance metrics across various infrastructure models such as Dell, HP, Cisco, VMware, Nutanix, and Hyper-V.
8) MicroFocus OpsBridge
A call monitoring service and event management tool that consolidates data from diverse sources for improved visibility.
9) Moogsoft
Moogsoft, based in San Francisco, is a data management and alert management platform. It serves as an enterprise cloud-native AIOps platform that includes monitoring and observability capabilities too.
The platform aids IT Ops and DevOps teams in streamlining operations by reducing noise, prioritizing events, minimizing escalations, and ensuring availability through enhanced visibility and monitoring tool control.
10) Netreo
Netreo streamlines workflow for seamless observability across the enterprise via a unified dashboard. It offers full-stack visibility into IT systems, applications, user experience, and infrastructure.
Netreo incorporates AI- and ML-based techs, including automatic dependency mapping, event correlation, and anomalistic behavior detection, building a robust backbone.
11) New Relic One
This platform is well-known for its cloud-driven Observability capabilities, providing simplified and centralized visualization, optimization, and troubleshooting for the entire software stack. The AIOps platform effectively monitors distributed applications and services, regardless of their deployment locations.
Moreover, its Telemetry Data Platform delivers a centralized, real-time perspective on operational data.
12) PagerDuty
PagerDuty offers crucial assistance in achieving higher uptime for improved operations, ROI, business continuity, and faster issue resolution. As a leading AIOps platform, it excels in monitoring and analyzing data, logs, networks, and websites.
Gain access to automated incident response, flexible schedules, alerting, escalations, runbook automation, event management, and operational analytics with PagerDuty. PagerDuty’s AIOps solution stands out with noise reduction, automation, and root cause analysis.
13) Sematext Monitoring
Sematext. Monitoring platform offers a comprehensive solution for collecting metrics and events across your stack. With 100+ integrations, it enables quick setup and effortless alerting and anomaly detection.
Achieve end-to-end observability for applications, servers, containers, processes, inventory, and events. Sematext simplifies troubleshooting, detecting production and performance issues through logs, metrics, synthetic, and real user monitoring.
14) Splunk Enterprise
Splunk Enterprise is a platform with a focus on accessibility, automation, end-to-end service monitoring, and robust analytics across various cloud infrastructures, guided by the belief that ‘data is everything.’ This platform simplifies data collection by enabling automatic retrieval from specified sources. Once the data is collected, it offers efficient data visualization and indexing for easy accessibility.
15) Zenoss Cloud
Zenoss Cloud serves as a comprehensive, monitoring service and AIOps platform, enabling in-depth understanding of data health and performance. This intelligent application, delivered via SaaS, offers strong AIOps analytics capabilities and provides full-stack monitoring features for various IT environments.
Notably, Zenoss operates without agents and instead utilizes a collector tool to gather system data, which is then sent to a central server for detailed analysis.
6 Key components in AIOps platforms to consider
AIOps platforms typically consist of several key components that work together to enable the integration of AI and machine learning technologies into IT operations. These components facilitate data analysis, visualization, and automation, allowing the platform to provide valuable insights and automate various tasks.
It’s essential to consider these key features during vendor evaluation, as different buyers may prioritize distinct capabilities within aspects such as monitoring or analysis. To prepare for your assessment, you can review our comprehensive explanations of these features below:
1.) Visibility
Visibility refers to how much the AIOps tool can collect data and provide comprehensive insights into the IT infrastructure, including physical and virtual components. Here are some examples:
- Data collection features: These components collect data from various sources within the IT environment. Data collection agents may include log collectors, monitoring agents, application performance monitoring (APM) agents, network probes, and other data connectors. They gather data from servers, applications, network devices, databases, and other infrastructure elements.
- Data ingestion and processing: Once the data is collected, it must be ingested into the AIOps platform and processed. This step involves data validation, normalization, and cleansing to ensure the data is in a suitable format for analysis.
2.)Monitoring and management
AIOps tools provide comprehensive monitoring and management capabilities, overseeing various aspects of the IT environment, including system performance, application behavior, network traffic, and more. Leveraging advanced algorithms and AI, they efficiently detect anomalies and patterns, enabling proactive identification of potential issues and facilitating effective IT infrastructure management. Some of these features are:
- Timely alerts: Timely alerts are immediate notifications sent to users or stakeholders when critical events, anomalies, or issues are detected in a system or process to enable swift and proactive response.
- API monitoring: It involves the continuous observation and analysis of Application Programming Interfaces (APIs) to ensure their availability, performance, and proper functionality, thereby identifying and resolving potential issues promptly.
- Ticket Accuracy: Evaluating the precision and correctness of issue descriptions and solutions in support tickets, aiming to improve the quality and effectiveness of customer support.
3.)Performance
Evaluating performance involves how well the AIOps tool can identify and analyze bottlenecks, resource utilization, and overall system efficiency. Some examples include:
- Performance Monitoring: Constant tracking and assessing system components and applications to gauge their efficiency, responsiveness, and overall functionality.
- Real User Monitoring (RUM): Gathering and analyzing data on how actual users interact with a website or application in real-time to optimize user experience and identify performance bottlenecks.
- Resource Monitoring: Continuously monitoring and measuring the utilization of hardware, software, and network resources to ensure efficient resource allocation and detect potential capacity issues.
4.)Functionality
Users assess the functionality of an AIOps tool, including its ability to integrate with existing systems, support various data formats, and offer relevant features to address specific IT operations challenges. Some of these functionalities are:
- AI and ML Algorithms: These are the heart of AIOps platforms. AI and ML algorithms analyze the data to detect patterns, anomalies, and correlations. Common AI and ML techniques used in AIOps include supervised and unsupervised machine learning, time-series analysis, natural language processing (NLP), and clustering.
- Cloud Observability: Implementing comprehensive monitoring and logging practices in cloud-based environments to gain insights into system behavior, performance, and potential problems for better management and troubleshooting.
5.)Issue resolution
This aspect evaluates the AIOps tool’s capability to identify and diagnose issues quickly and accurately, helping IT teams to resolve problems efficiently. Common AIOps techniques used in issue resolution cover:
- Event correlation and root cause analysis: These components analyze and correlate data from multiple sources to identify the root cause of incidents or performance issues. Event correlation helps establish relationships between different events and components to understand the impact of one on the other.
- Anomaly detection: An important component of AIOps platforms, anomaly detection algorithms identify unusual behavior or events in the IT environment. Anomalies can indicate potential issues that require further investigation and resolution.
6.)Analysis
This aspect involves the visual representation of data through dashboards, charts, graphs, and other means to provide clear and actionable insights. AIOps tools use advanced analytics to process vast amounts of data and present it in a way IT teams can easily interpret and act upon. Some of the most common features of analysis are:
- Visualization and dashboards: AIOps platforms often provide visualizations and interactive dashboards to present the analyzed data in a user-friendly manner. These visualizations help IT teams quickly grasp the state of the IT environment and identify trends and anomalies visually.
- Predictive analytics: Some AIOps platforms offer predictive analytics capabilities. They can forecast potential issues and resource demands by analyzing historical data and trends, helping IT teams proactively address challenges.
How to choose the right AIOps platform for your business?
Selecting the appropriate AIOps platform hinges on aligning it with your business’ specific requirements, objectives, and existing infrastructure. For instance, your organization want to leverage AIOps platforms with automated root cause analysis feature or strong infrastructure monitoring capabilities.
To identify the best AIOps platforms for your business, we recommend following these steps:
- Identify your requirements and objectives
- Review the features for AIOps platforms that we shortlisted based on the B2B review numbers and scores
- Consider their pros and cons of these tools to downsize the list
- Communicate with the vendors, watch demos and start free trials if applicable.
What is an AIOps platform?
AIOps stands for “Artificial Intelligence for IT Operations.” It is a term used to describe the application of artificial intelligence (AI) and machine learning (ML) techniques to enhance and automate various aspects of IT operations capacity planning and management.
AIOps aims to improve the efficiency, reliability, and agility of IT operations by leveraging advanced analytics, automation, and AI algorithms to process and interpret vast amounts of data generated from different sources in an IT environment. These sources may include system logs, monitoring tools, application performance data, network metrics, cloud resources, and more.
How do AIOps platforms work?
AIOps platforms function by:
- Collecting vast amounts of data from various IT sources, such as logs and metrics.
- Ingesting and preprocessing data to remove noise and normalize it.
- Using AI and ML algorithms to analyze data and detect anomalies, correlations, and patterns.
- Employing contextualization and correlations to understand the IT environment better.
- Applying anomaly detection to identify deviations from normal behavior.
- Triggering incident management processes and performing root cause analysis in case of issues.
- Providing predictive and prescriptive insights
- Continuously learning from new data to improve accuracy over time.
Further reading
Discover more on AIOps, MLOps, and DevOps by reading our data-driven and detailed articles:
- MLOps vs DataOps: Key Similarities & Differences
- MLOps: In-depth Guide to Benefits, Examples & Tools
- ChatGPT AIOps in IT Automation: 8 Powerful Examples
External resources
- 1. “Dynatrace platform exaple.” Dynatrace. Revisited August 2, 2023.


Comments
Your email address will not be published. All fields are required.