Syslog monitoring collects event data from applications and sends it to a central server, helping to track events, statuses, and diagnostics. Effective syslog monitoring can automate tasks, send alerts, and reduce downtime, minimizing user disruptions.
See the top 5 syslog monitoring tools, focusing on the features that make them suitable for enterprise-level syslog management:
| Vendor | Rating* | Price | Free Trial |
|---|---|---|---|
| Paessler PRTG Network Monitor | 4.5 based on 336 reviews | Starting $ 1,810 up to 50 devices | ✅ for 30-days |
| ManageEngine EventLog Analyzer | 4.8 based on 14 reviews | Not shared publicly. | ✅ for 30-days |
| SolarWinds Kiwi Syslog Server NG | 4.5 based on 2 reviews | One-time $ 395 | ✅ for 14-days |
| Nagios Log Server | 4.5 based on 4 reviews | Starting at $1,995 one-time | ✅ for 14-days |
| Graylog | 4.4 based on 116 reviews | Starting at $1,250/mo* 10GB per day | NA |
* Reviews are based on Capterra and G2 and are on a scale of 5.
Sorting: Vendors are ranked according to their average ratings, except sponsors which receive links.
Syslog Monitoring Software Comparison
1. Paessler PRTG Network Monitor
Paessler PRTG Network Monitor is an all-in-one monitoring solution designed for organizations looking for visibility into their network.
It combines syslog monitoring with other functionalities, like bandwidth usage and application performance tracking.
Key Features:
- Preconfigured sensors for syslog, SNMP, and Windows Event Log monitoring.
- Real-time dashboards with customizable visualizations.
- Send notifications with flexible thresholds and integrations.
- Scalability to support large, complex networks.

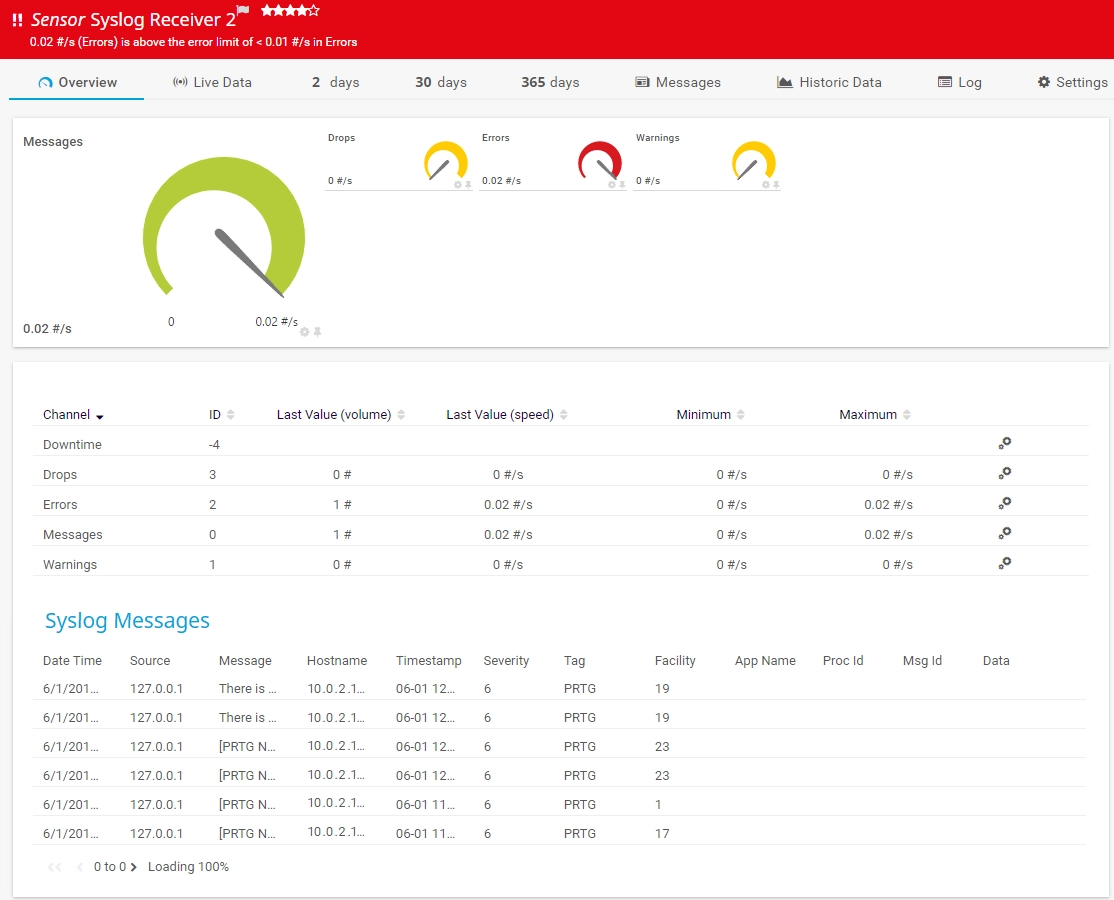
Source: Paessler PRTG Network Monitor 1
In PRTG, syslog monitoring involves tracking system messages and log data to help identify network issues. It provides information such as the source, severity level, and timestamp of system errors, along with other key metrics in real time. The data is displayed in graphs and dashboards, allowing users to visualize trends and pinpoint potential problems.
2. ManageEngine EventLog Analyzer
ManageEngine EventLog Analyzer is a log management and compliance tool that simplifies monitoring and reporting for IT teams. It is particularly suited for organizations with compliance needs.
Key Features:
- Prebuilt compliance reports for standards like GDPR, HIPAA, and PCI DSS.
- Log forensics and incident investigation tools.
- Multi-platform support, including Windows, Linux, and network devices.
- Automated alerting and workflow management for IT operations.

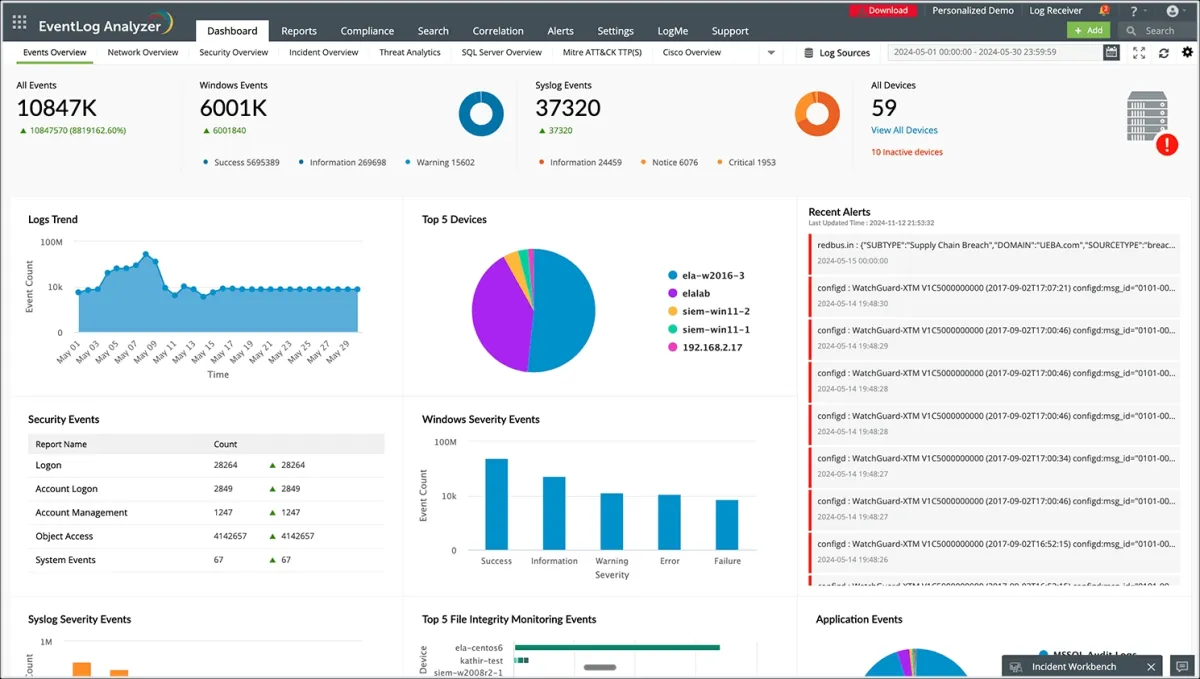
Source: ManageEngine EventLog Analyzer 2
EventLog Analyzer collects, organizes, and filters Syslog messages from various network devices, including routers, switches, firewalls, and Unix/Linux servers. It can configure alerts via SMS or email for specific events, enabling timely awareness of network activity.
The tool includes dashboards and reports designed to visualize potential network infrastructure issues, helping to identify anomalies. Its components include a syslog listener for gathering data over UDP or TCP port 514, a PostgreSQL database for log storage, and a log parser that extracts relevant information by filtering out unnecessary data based on parameters such as event type or device name. A free version is available for monitoring up to five sources.
3. SolarWinds Kiwi Syslog Server NG
The SolarWinds Kiwi Syslog Server NG is a network monitoring tool designed to collect, process, and manage syslog monitoring messages from various devices in your network.
It helps administrators centralize log management, streamline troubleshooting, and maintain security compliance by providing insights into system events, errors, and performance issues.
Key Features:
- Collects and organizes syslog messages from routers, switches, firewalls, Linux and Unix servers, and other syslog-enabled devices.
- Filters syslog monitoring messages based on criteria such as source, content, or severity, allowing for easier focus on relevant events.
- Configures alerts to notify administrators via email or scripts when critical events are detected.
4. Nagios Log Server
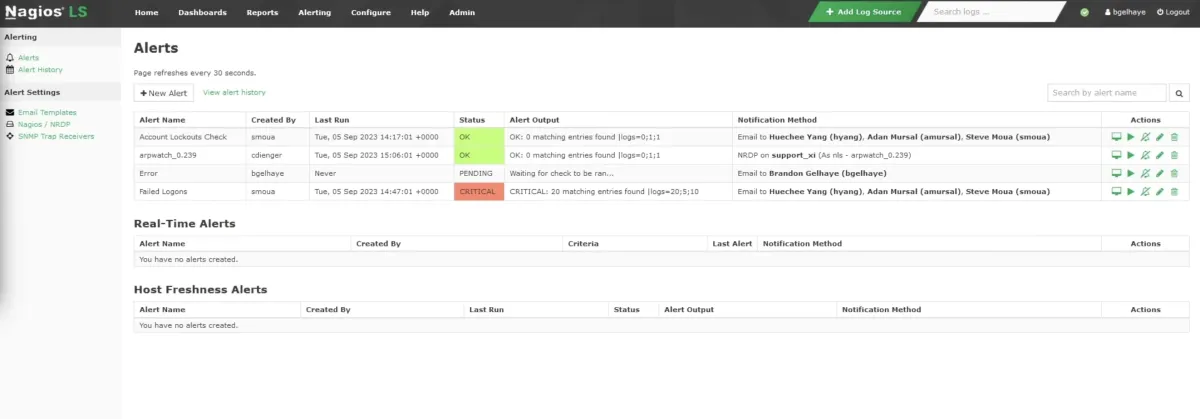
Nagios Log Server provides syslog monitoring by collecting, processing, and managing log data from various network devices and systems. Nagios Log Server acts as a centralized repository for all syslog messages generated by network devices like routers, switches, firewalls, and servers. It can receive log data from any device capable of sending syslog messages via the standard UDP/TCP port 514 or other configurable ports.

Key Features:
- The server automatically parses incoming syslog messages and organizes them for easier analysis.
- Filters can be applied to isolate specific log types or critical events, allowing for the efficient identification of issues within the network.
- It continuously monitors syslog messages and provides real-time alerts based on predefined criteria, such as specific error codes, critical events, or unusual activity.
- Alerts can be sent via email, SMS, or integrated communication platforms to notify administrators of potential threats.
5. Graylog
Graylog is an open-source Syslog monitoring and log management tool that provides powerful search and analysis capabilities. It supports multiple log formats, including Syslog and JSON, and offers extensibility through plugins. Graylog’s real-time alerts and customizable dashboards make it an ideal choice for enterprises that require scalability and tailored solutions. While it is cross-platform, it is most commonly used on Linux systems.
Key Features:
- Centralized log management with search and filtering options.
- Highly scalable architecture for growing data volumes.
- Built-in dashboards and custom widgets for data visualization.
- Support for integrations with various tools via REST APIs.

Source: Graylog 3
Setting Up Syslog Monitoring
Setting up syslog monitoring involves several essential steps to ensure effective log collection, storage, and analysis:
- Identify Devices to Monitor
Start by identifying the devices that generate log messages, such as servers, routers, switches, firewalls, and other network equipment. These devices will be the primary sources of your syslog data. - Configure Devices to Forward Logs
Configure each device to send its log messages to a central location, such as a syslog server or a log analytics platform like SigNoz. This is typically done through the device’s configuration settings, where you specify the IP address and port of the syslog server. - Set Up a Syslog Server
Deploy a syslog server to act as the central repository for all collected log messages. This server can be a dedicated physical machine, a virtual server, or a cloud-based solution. Options range from free, open-source tools (e.g., Rsyslog, Graylog) to commercial solutions with advanced features. - Configure the Syslog Server
- Allow devices to send logs by specifying their IPs or hostnames.
- Set up filters to process, categorize, and prioritize log messages based on severity levels (e.g., errors, warnings).
- Define storage and indexing rules to manage log retention and ensure that logs are easily searchable and analyzable.
- Set Up Alerts and Notifications
- Create alerts for critical events to notify administrators of issues in real-time. For example, configure email, SMS, or app-based notifications for events like system failures, security breaches, or resource thresholds being exceeded.
- Use your syslog server’s built-in alerting features or integrate with external monitoring tools for more notifications and automation.
- Test and Optimize
- Verify that devices are successfully forwarding logs to the syslog server.
- Test alerts to ensure they trigger correctly for critical events.
- Fine-tune log filters and notification thresholds to reduce noise and focus on actionable insights.
By implementing syslog monitoring effectively, you can centralize log management, enhance system visibility, and respond to issues promptly, thereby minimizing disruptions and improving network reliability.
Key Benefits of Syslog Network Monitoring Tools:
1. Centralized Log Management
- Aggregate logs from multiple sources such as servers, firewalls, switches, routers, and applications into a single platform.
- Simplifies monitoring by providing a unified view of system events, reducing the need to check logs on individual devices manually.
2. Proactive Issue Detection
- Monitors real-time syslog messages to detect and alert on potential issues, such as hardware failures, misconfigurations, or security breaches.
- Allows administrators to respond to problems before they impact operations.
3. Improved Network Security
- Enhances incident response by providing detailed logs for forensic analysis and determining the root cause.
- Identifies unusual patterns or unauthorized access attempts through syslog messages, helping to detect intrusions or vulnerabilities.
4. Efficient Troubleshooting
- Provides search and filtering capabilities to pinpoint specific log entries quickly.
- Speeds up problem resolution by correlating logs from different devices and systems.
5. Enhanced Network Visibility
- Provides insights into network performance, device health, and the overall status of the infrastructure.
- Helps identify bottlenecks, latency issues, or devices that require maintenance or upgrades.
6. Compliance and Audit Readiness
- Maintains long-term log archives to meet regulatory requirements and internal policies.
- Generates reports for audits and compliance checks, such as PCI DSS, GDPR, HIPAA, or ISO 27001.
FAQ
What is Syslog, and how does it work?
Syslog is a standard protocol for collecting and storing log messages from various devices and applications. A Syslog server receives, parses, stores, and analyzes these messages, enabling centralized logging for routers, switches, firewalls, and more. It uses severity levels to classify logs and employs either UDP (port 514) or TCP (port 601) for message transmission.
What is the difference between Syslog servers and clients?
Syslog Server: A centralized device or software that collects and stores logs from multiple devices, offering administrators a single source for monitoring.
Syslog Client: Any device or application that sends log messages to a Syslog server, such as firewalls, routers, or Linux/Windows systems.
What are common use cases for Syslog monitoring?
Network Devices: Monitoring routers, switches, and firewalls for performance, unauthorized access, and malicious traffic.
Operating Systems: Tracking user activity, auditing access, and diagnosing system issues like high CPU usage.
Applications: Debugging, monitoring database queries, and detecting attacks on web servers or VPNs.
How does Syslog compare to SNMP?
While Syslog provides passive monitoring, focusing on responding to events, SNMP offers active monitoring to prevent incidents. Therefore, syslog monitoring takes a passive approach, focusing on addressing issues after they occur.
Both complement each other in IT infrastructure management.
For more on network monitoring
- Enterprise Network Monitoring: 7 Best Practices
- Top 10 Network Monitoring Software/Network Management Software based on 3K+ Reviews
- Top 7 Free Network Monitoring Tools based on 1,000+ Reviews
- Top 5 Network Performance Monitoring Tools

Comments
Your email address will not be published. All fields are required.