The ability to measure network performance is more crucial than ever for businesses to ensure seamless operations. To address this challenge, understanding and effectively utilizing network performance metrics becomes the key resolution.
Key Network Performance Metrics
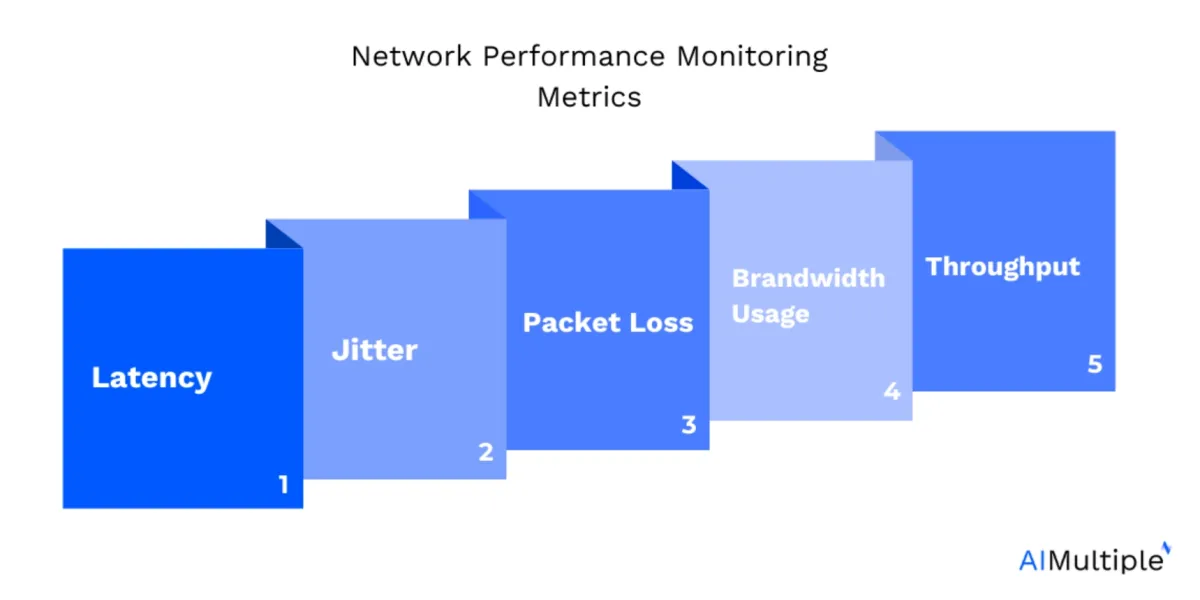
1- Latency
This refers to the time it takes for a data packet to travel from the source to the destination. It’s usually measured in milliseconds (ms). Lower latency is vital for real-time applications like video conferencing and online gaming.
2- Jitter
Jitter is the variability in the arrival time of data packets. Consistent packet delivery is crucial for real-time applications such as VoIP and video conferencing. High jitter results in delays, choppy audio, or disrupted video. Measuring jitter with tools like iPerf or PingPlotter can help identify patterns of instability. Acceptable jitter levels are typically under 30ms. Causes of jitter include network congestion, hardware limitations, or poor-quality connections. Solutions may involve prioritizing real-time traffic through Quality of Service (QoS) settings.
3- Packet loss
Packet loss occurs when data packets fail to reach their intended destination, disrupting communication and causing issues like application timeouts or data corruption. Packet loss often signals network congestion, faulty hardware, or software misconfigurations. Monitoring tools like Wireshark or PRTG can track packet loss in real time. Ideally, packet loss should remain below 1%, especially for high-availability systems. Persistent packet loss may require a review of network capacity or an investigation into faulty links or devices.
4- Bandwidth
Bandwidth utilization measures the percentage of a network’s total capacity in use at a given time. High utilization rates can lead to congestion and degraded performance for critical applications. Monitoring tools like SolarWinds Network Performance Monitor (NPM) or PRTG can provide real-time analytics to help identify patterns of excessive usage.
It’s important to differentiate between normal peaks (e.g., backups or updates) and unusual spikes that may indicate misuse or a network issue. Keeping bandwidth utilization below 80% of capacity is generally recommended to prevent bottlenecks.
5- Throughput
Throughput measures the actual amount of data successfully transmitted over the network within a specific timeframe. It is a critical metric for assessing how well the network handles traffic under various conditions.
Factors such as latency, packet loss, and bandwidth utilization have a direct impact on throughput. Using tools, you can measure throughput during both peak and non-peak hours. By comparing throughput against bandwidth capacity, you can identify whether your network is underperforming or requires optimization.
What are other elements for analyzing network performance metrics?
Apart from these essential network performance metrics, there are others that can be used to analyze the performance of the system:
6- Error rate
This refers to the number of corrupted packets over a network compared to the total sent. A high error rate can indicate problems with network hardware or interference.
7- Availability
This metric measures the time a network is available and operational, often represented as a percentage. High availability is crucial for critical systems, where downtime can result in significant business losses.
8- Utilization
This measures the extent to which network resources are being used. It helps in capacity planning and ensuring that the network can handle peak demands.
9- Round-Trip Time (RTT)
RTT measures the time it takes for a signal to go from the source to the destination and back again. It’s essential for understanding the network’s responsiveness.
10- Quality of Service (QoS)
While not a metric per se, quality of service refers to the overall performance of the network and its ability to prioritize different types of traffic, which is essential in ensuring that critical applications receive the bandwidth they require.
11- Connection time
The time it takes to establish a connection between two points in the network. This can be important for systems where rapid connection establishment is critical.
12- Server response time
Response Time
Response time refers to the speed at which a server or device responds to a request. It is a critical metric for evaluating user experience, especially for web-based applications or services. Long response times may indicate overloaded servers, network congestion, or inefficient application design. Synthetic monitoring and application performance monitoring (APM) tools can measure response times across different locations. Ideally, response times should remain under 200ms for most applications, ensuring a seamless user experience.
13- Network congestion levels
Indicates the level of traffic load on the network. High congestion can lead to increased packet loss and latency.
14- Retransmission rate
The frequency with which data packets are retransmitted over the network. High retransmission rates can indicate problems with network stability or congestion.
15- Error rates by type
Error rates measure the frequency of data transmission errors, including dropped packets, CRC errors, and retransmissions. High error rates often indicate hardware failures, interference, or network misconfigurations. Using SNMP-based monitoring tools, you can track error rates at the interface level to identify problematic devices or links. A low error rate is crucial for maintaining the reliability of your network. Immediate action should be taken to replace faulty cables, upgrade firmware, or reconfigure settings when errors are detected.
16- Session duration
The length of time a network session remains active. This can be important for understanding user behavior and network usage patterns.
17- Signal strength
In wireless networks, the strength of the signal is a key factor in performance, affecting data rates and connection quality.
18- Signal-to-Noise Ratio (SNR)
In wireless communications, SNR compares the level of the desired signal to the level of background noise. A higher ratio means a clearer and better quality signal.
19- Network reachability
Measures the ability to connect to and communicate with various parts of a network.
20- Goodput
Similar to throughput, goodput measures the rate of successful delivery of payload data (excluding protocol overhead and retransmitted data).
21- Path change frequency
Indicates how often the path taken by data through the network changes, which can affect performance and stability.
22- DNS lookup time
The time it takes to resolve a domain name into an IP address. This is crucial for web browsing and accessing online services.
23- Application-specific metrics
For networks supporting specific applications, metrics tailored to the performance requirements of these applications (like video streaming quality, voice clarity in VoIP, etc.) can be crucial.
24- Capacity
The total data-carrying capacity of a network. Understanding capacity is essential for planning expansion and scaling.
25- Network efficiency
Measures how effectively the network uses its resources. This can include metrics like bandwidth efficiency, power efficiency in wireless networks, etc.
26- Cost per data unit
In certain contexts, particularly in business environments, understanding the costs associated with transmitting a specific amount of data is crucial for budgeting and cost optimization.
27- CPU and Memory Utilization on Network Devices
Monitoring the CPU and memory usage of routers, switches, and firewalls helps ensure that these devices can handle current and future network demands. Overloaded devices can result in packet loss, latency, or complete outages. Tools like SNMP and vendor-specific management consoles can track resource utilization. Keeping device utilization under 70% during peak times is generally recommended to avoid performance degradation.
27- Network Traffic Composition
Understanding the types and sources of traffic on your network is critical for managing bandwidth effectively and identifying potential security threats. Tools like Wireshark or NetFlow analyzers provide detailed insights into the composition of network traffic, including applications, protocols, and endpoints. By analyzing this data, you can prioritize mission-critical traffic and identify bandwidth-intensive or suspicious activities that require immediate attention.
28- Network Availability (Uptime)
Network availability tracks the percentage of time the network is operational and accessible. High availability is essential for ensuring uninterrupted service delivery and business continuity. Real-time monitoring tools like Nagios XI or SolarWinds can provide insights into uptime metrics. Aim for 99.99% uptime or higher for mission-critical systems to minimize disruptions and ensure optimal performance. Regular hardware maintenance, redundancy planning, and failover systems can enhance availability.
29- Round-Trip Time (RTT)
Round-Trip Time (RTT) is a crucial metric for understanding the overall responsiveness of your network. It measures the time taken for a signal to travel from a source to a destination and back again. High RTT values indicate potential delays in data transmission, which can impact real-time applications such as online gaming or financial trading platforms. Tools such as Ping and Traceroute enable you to monitor Round-Trip Time (RTT), which helps identify latency issues caused by inefficient routing or congestion.
30-TCP Retransmission Rate
The TCP retransmission rate indicates the frequency at which data packets need to be retransmitted due to loss or errors. High retransmission rates often signal underlying issues such as poor link quality, interference, or network congestion. For example, a 5% retransmission rate in a corporate network could lead to noticeable slowdowns in data transfers or degraded application performance.
How can the network performance metrics be analyzed?
Analyzing and utilizing network performance data is crucial for maintaining optimal network operations, ensuring security, and making informed decisions for future network planning and improvements. Here’s a guide on how to effectively analyze and use network performance metrics:
1. Data collection
- Utilize network monitoring tools to gather data on key performance metrics, including bandwidth usage, latency, packet loss, jitter, throughput, and error rates.
- Ensure continuous monitoring for real-time data and historical analysis.
2. Data analysis
- Identify Trends: Look for patterns in network performance metrics over time. This could include peak usage times, recurring periods of high latency, or frequent packet loss.
- Benchmarking: Compare current network performance metrics against established benchmarks or standards to evaluate if the network is performing optimally.
- Root Cause Analysis: When issues are identified (like high latency), delve deeper to find the root cause (such as network congestion, hardware failure, etc.).
- Correlation Analysis: Determine how different metrics are related to one another. For example, how bandwidth utilization impacts throughput and latency.
3. Performance optimization
- Address Identified Issues: Use your analysis to resolve issues. This might involve rerouting traffic, upgrading hardware, or optimizing configurations.
- Capacity Planning: Use historical data to predict future network needs and plan for capacity upgrades.
4. Security analysis
- Anomaly Detection: Look for unusual patterns that might indicate security breaches, such as unexpected spikes in traffic, which could signify a DDoS attack.
- Compliance Monitoring: Ensure that network usage complies with relevant policies and regulations.
5. Reporting and documentation
- Create reports for various stakeholders, including IT staff, management, and others, that highlight network health, performance issues, and improvements.
- Maintain documentation for future reference and for tracking the evolution of network performance metrics over time.
6. Proactive management
- Implement alerts based on predefined thresholds for key metrics to receive notifications of potential issues before they escalate into critical situations.
- Regularly review and adjust thresholds and alerts as the network and its usage evolve. We have an article on proactive network performance monitoring.
7. Cost management
- Analyze network performance metrics to identify areas of inefficient resource utilization.
- Optimize network configurations and resource allocation to reduce costs without impacting performance.
8. Quality of Service (QoS) adjustments
- Prioritize network traffic based on business needs to ensure critical applications have the necessary resources.
9. Future planning
- Utilize trend analysis for long-term planning purposes, such as network expansion or upgrades.
- Assess the impact of new technologies or applications on the network before deployment.
10. User Experience monitoring
- Monitor metrics that directly impact user experience, like latency and jitter in VoIP and video conferencing, to ensure user satisfaction.
FAQ
What is network performance monitoring?
Network performance monitoring (NPM), a fundamental aspect of network management, involves the continuous observation and analysis of network performance. It aims to ensure the network’s ability to efficiently and reliably handle data traffic and support various applications.
What are the tools for measuring network performance?
Network performance monitoring software is essential for maintaining optimal network operations, as it offers real-time visibility into the health and performance of a network, unlike manually determining network performance. Network monitoring tools enable proactive detection and troubleshooting of issues, ensuring minimal downtime and disruptions. Additionally, they provide valuable insights for strategic planning and capacity management, and contribute to maintaining network security and compliance with industry standards.
Read more: Network performance monitoring tools, network security audit tools, SDP software.
Why are network performance metrics important?
These metrics are essential for maintaining a stable and high-performing network. They help identify bottlenecks, ensure resource availability, prevent downtime, and enhance the user experience. Monitoring metrics can also improve security by detecting unusual traffic patterns.
Which network performance metrics are most critical?
The most critical metrics depend on the specific use case, but commonly include:
Bandwidth Utilization: Tracks the percentage of network capacity in use.
Latency: Measures the delay in data transmission.
Packet Loss: Indicates the percentage of lost data packets.
Jitter: Measures variability in packet delivery times.
Throughput: Reflects the actual amount of data successfully transmitted.
What is acceptable packet loss?
Ideal latency depends on the application. For general web browsing, latency under 100ms is acceptable, while for real-time applications like VoIP or gaming, it should be below 50ms for optimal performance.
How often should network metrics be monitored?
Continuous real-time monitoring is recommended for critical networks to ensure prompt issue detection and resolution. For smaller or less critical networks, periodic monitoring with regular audits can suffice.
What tools are best for monitoring network metrics?
Popular tools for monitoring network performance metrics include:
SolarWinds NPM for comprehensive monitoring.
Paessler PRTG for flexible and customizable setups.
Wireshark for detailed packet analysis.
Nagios XI for advanced alerts and reporting.
If you have questions or need help in finding vendors, feel free to reach out:


Comments
Your email address will not be published. All fields are required.