Log analysis software gathers, parses, and analyzes log data from several sources, including servers, network devices, and apps. System administrators use log analysis software for monitoring & debugging systems and analyzing system performance.
Here are the top 10 log analysis software based on my & other users’ experiences and vendor features. Follow the links to see vendors’ best practices:
| Vendor | Focus | |
|---|---|---|
1. | -Security information and event management (SIEM) | |
2. | -Enterprise monitoring | |
3. | -Log analysis | |
4. | -Security information and event management (SIEM) -Enterprise monitoring | |
5. | -Enterprise monitoring | |
6. | -Security information and event management (SIEM) -Enterprise monitoring | |
7. | -Security information and event management (SIEM) | |
8. | -Security information and event management (SIEM) | |
9. | -Enterprise monitoring | |
10. | -Security information and event management (SIEM) -Enterprise monitoring | |


Vendors focusing on enterprise monitoring
These vendors offer:
- infrastructure monitoring
- application performance monitoring (APM)
- log analysis capabilities
They can help SOCs monitor infrastructure or application topologies to identify bottlenecks, hence these vendors are essential debugging solutions for enterprise-wide actions.
Vendors focusing on log analysis
Vendors focusing on log analysis are also essential debugging solutions since they correlate log data to identify and pinpoint the underlying causes of issues.
However, compared to enterprise monitoring vendors, they provide less visibility (lack infrastructure and application performance monitoring (APM)).
Vendors focusing on SIEM
Vendors focusing on SIEM aim to collect log data from IT applications, systems, and technical infrastructure, they can generate useful operational information and alert incident response teams.
However, they are ineffective for context-based troubleshooting since they do not provide any instrumentation to monitor infrastructure or application issues.
Note: Buyers already using enterprise monitoring software (e.g. APM tool) can integrate machine and log data to your SIEM platform for context-based log analysis.
Market presence and feature comparison
| Vendor | Average rating | # of employees |
|---|---|---|
| ManageEngine Log360 | 4.5 based on 22 reviews | 387 |
| Dynatrace | 4.4 based on 1,494 reviews | 5,018 |
| LogicMonitor LM Logs | 4.5 based on 843 reviews | 1,122 |
| Datadog | 4.4 based on 775 reviews | 7,401 |
New Relic | 4.3 based on 614 reviews | 2,727 |
| Sumo Logic | 4.2 based on 314 reviews | 901 |
| Splunk Enterprise Security | 4.3 based on 293 reviews | 9,229 |
| Graylog Enterprise | 4.3 based on 164 reviews | 132 |
| SolarWinds Observability SaaS | 4.3 based on reviews 146 | 2,625 |
| Coralogix | 4.8 based on 143 reviews | 359 |
See vendor selection criteria.
SOAR: Vendors with (security orchestration, automation, and response) SOAR, and (user and entity behavior analytics). For more: Top 10+ SOAR software.
Insights (below) come from our experience with these solutions as well as other users’ experiences shared in Gartner 1 , G22 , and TrustRadius3
ManageEngine Log360
Source: ManageEngine4
ManageEngine Log360 is a SIEM platform that provides log analysis and helps streamline security center operations. The solution supports help desk software integrations with Jira Service Desk, ServiceNow, Zendesk, Kayako, and ManageEngine ServiceDesk Plus.
ManageEngine Log360 enriches log analysis with several key features, combining monitoring, threat detection, and response capabilities:
- Threat detection by leveraging integrated data loss prevention (DLP) capabilities.
- (User and entity behavior analytics (UEBA) by monitoring the log data to establish patterns in your network.
- Security orchestration, automation, and response (SOAR) by conducting incident investigation and response.
For example, users who are looking to investigate logs can use Log360’s predefined attack patterns to define unique rules, set time intervals, and apply filters.
Furthermore, Log360’s forensic analysis capabilities users can locate the point of attack in the network to see which network component is exploited.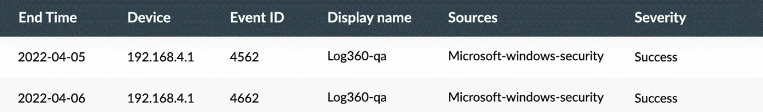
Source: ManageEngine5
Additionally, the solution supports help desk software integrations with Jira Service Desk, ServiceNow, Zendesk, Kayako, and ManageEngine ServiceDesk Plus.
Choose ManageEngine Log360 to support your log management operations with SEM enrichment.
Dynatrace
Dynatrace is an application performance monitoring software for infrastructure observability with log data analytics. Dynatrace provides ingest support for more than 600 log sources including:
- Native integration with all AWS services
- Support for common log sources such as Syslogs, networking, Fluent Bit, and FluentD
- API integration for Azure and Google Cloud
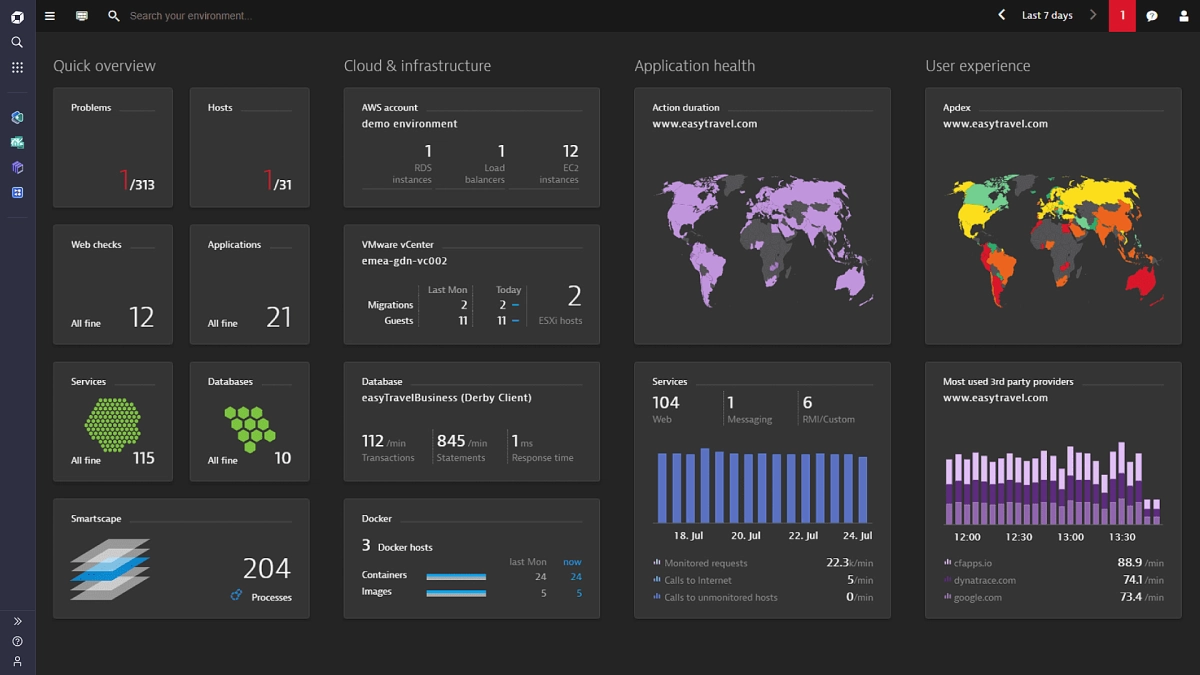
With Dynatrace you can utilize a log distribution dashboard, powerful search, and customized filters that don’t require a query language.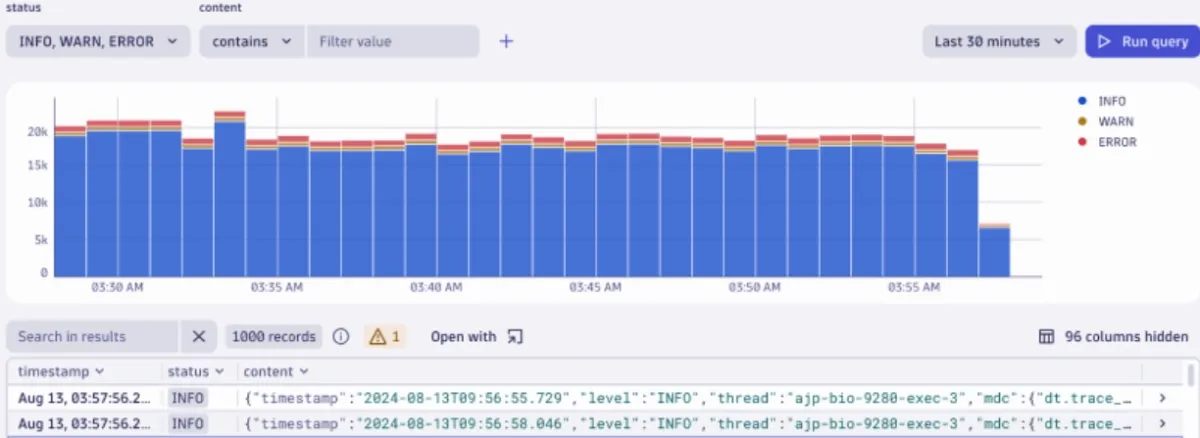
Additionally, Dynatrace enhances log management and analysis by integrating the Davis AI assistant, which provides automation and actionable insights. With Davis, you can:
- Pre-process of common log formats, such as JSON, for improved search and filtering capabilities
- Describe logs using natural language
LogicMonitor LM Logs
Source: LogicMonitor6
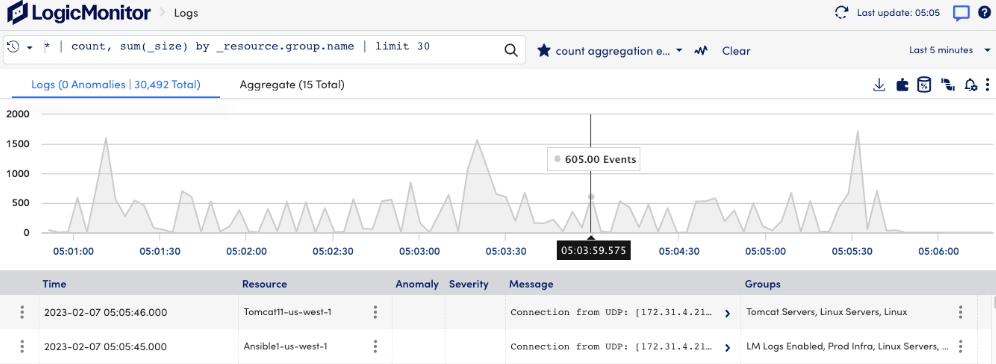
LogicMonitor LM logs provide numerous options to collect log data into the LM Envision anomaly detection platform for monitoring and analysis. With LogicMonitor LM Logs you can display log events and anomalies which may be analyzed using keyword search and filtering.
It is especially well-suited for enterprises with distributed IT infrastructures since it can monitor and manage IT systems across multiple sites and data centers. LogicMonitor LM logs can monitor and collect logs from:
- Networks
- Servers
- Virtual machines
- SD-WANs
- SaaS platforms
- Websites
- Databases
During the log ingestion processes, LogicMonitor LM Logs analyzes log files, transforming raw data into actionable insights. LogicMonitor can:
- Forward Syslog logs using standard TCP protocols. (across network devices, firewalls, routers, and switches.
- Forward Syslog logs from Unix-based systems. (across Linux servers)
- Forward logs from Kubernetes clusters (across containers – kubernetes)
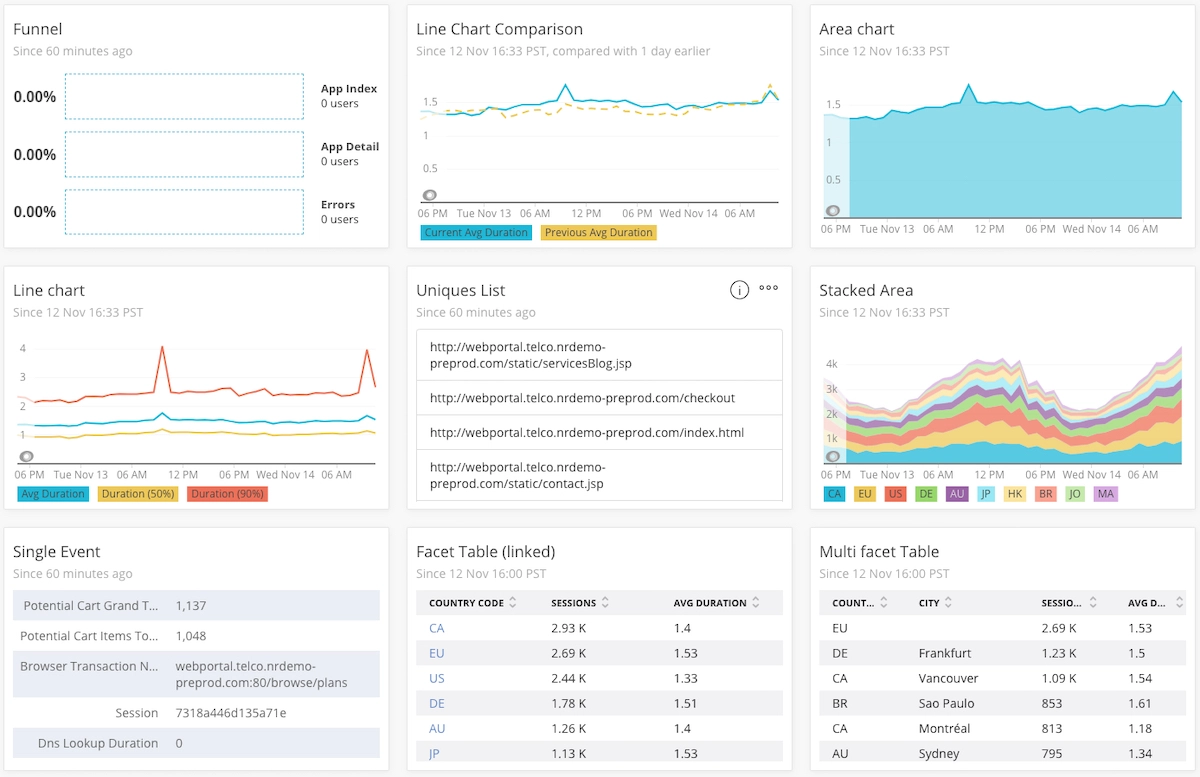
Datadog
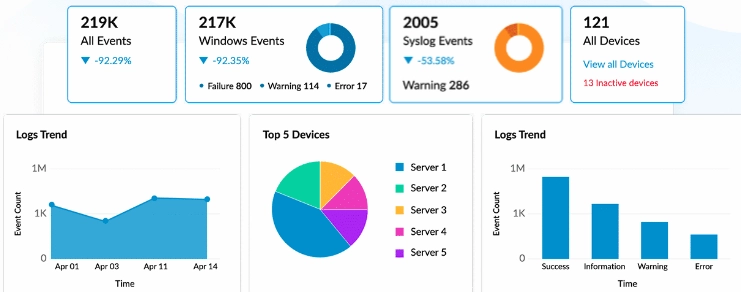
Source: Datadog7
Datadog is a cloud-based monitoring and analytics software Datadog collects log data from various sources, including servers, databases, cloud services, containers, and apps. Enterprise DevOps uses Datadog to monitor their infrastructure, apps, and logs and support cloud SIEM operations.
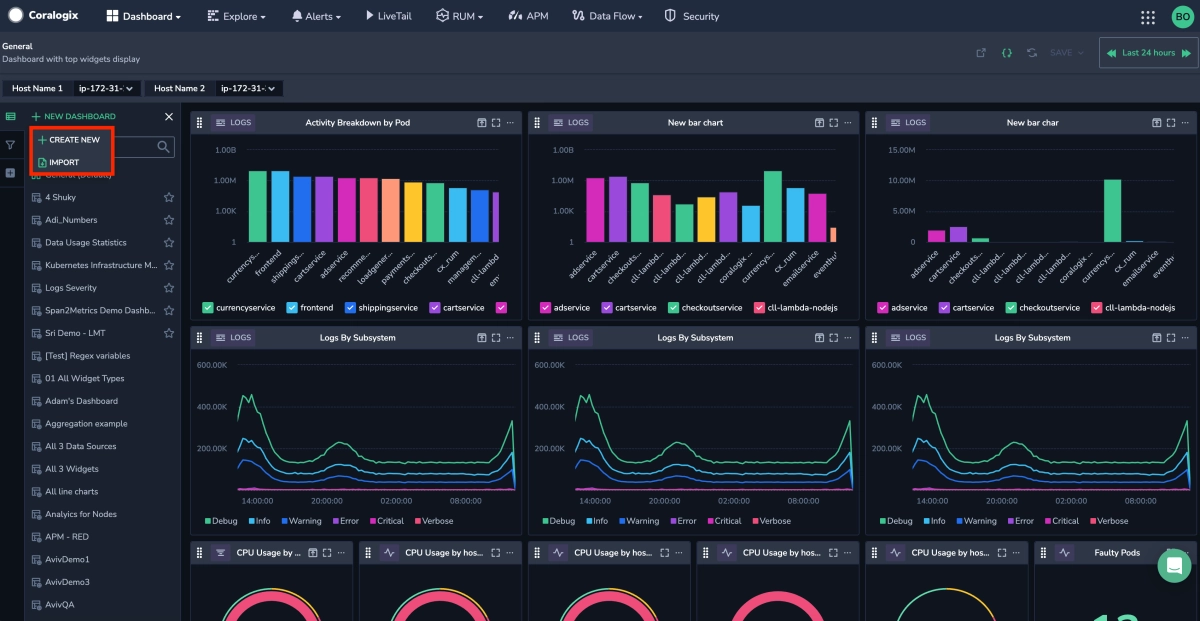
With Datadog users can leverage drag-and-drop capabilities to create log analytics dashboards to view log data in context using auto-tagging and metric correlation
For example, IT operations teams can assess the percentage of service logs that include errors. Any query’s results may be shown as top lists, or time-series graphs.
Additionally, Datadog’s log recommendation engine, the “Watchdog Insights tool” can notify teams if a certain host, service, or log asset displays unusually high errors. This helps on-call engineers and incident specialists navigate investigations involving new systems.
New Relic
New Relic is a monitoring platform. It also offers log tracking & analysis of your applications, infrastructure, and web browsers.
With New Relic users can gain visibility into application and infrastructure data (logs received, log errors, etc). Also, on the New Relic main logs UI page, you can see all of your logs and then filter down to logs with specified content.
Sumo Logic
Source: Sumo Logic8
Sumo Logic offers cloud monitoring, log management, and cloud SIEM capabilities. The solution provides detailed network insights for compliance, you can visualize inbound network activity based on host IPs for audits.
Splunk Enterprise Security
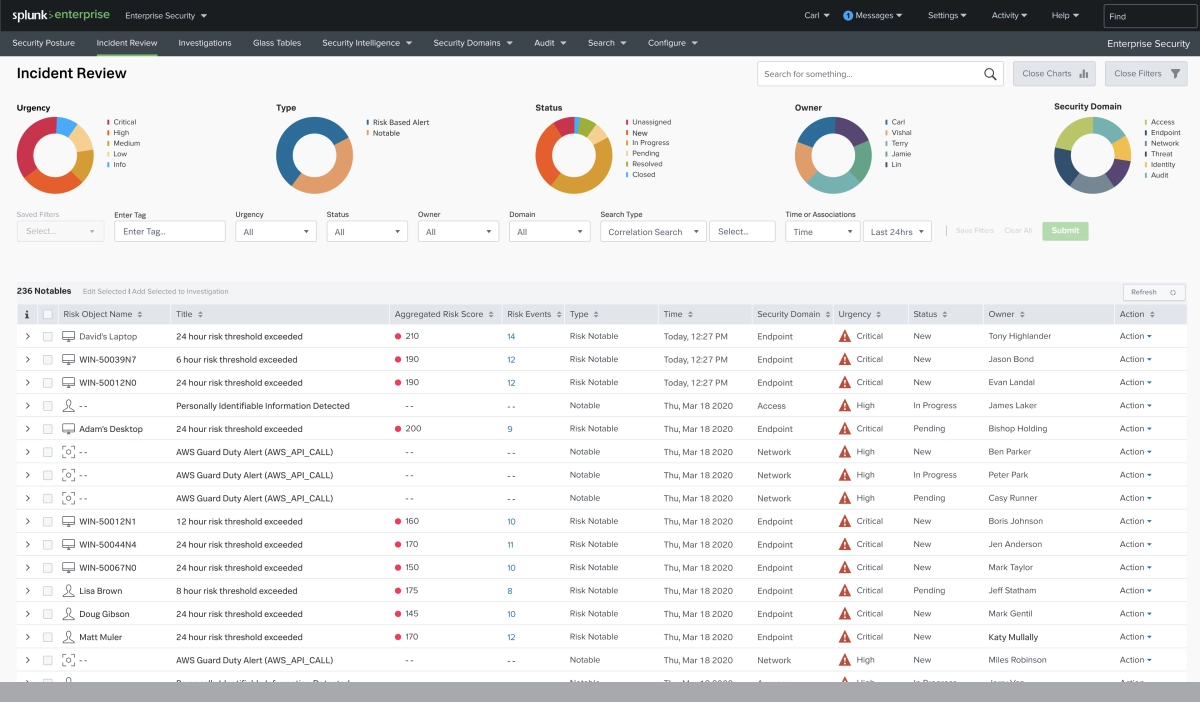
Splunk Enterprise Security is a SIEM solution that collects data from several sources, including log files, and network traffic.
It categorizes and saves data in a searchable format. This allows users to leverage SPL (Search Processing Language), to identify particular events, trends, or anomalies in log data.
For example, with Splunk Enterprise users can execute several log investigations, such as investigating decoded HTTP requests. The below example shows that the majority of the access was performed by the suspicious php file “cc8356c82af96ee7994175bb86a8da87.php”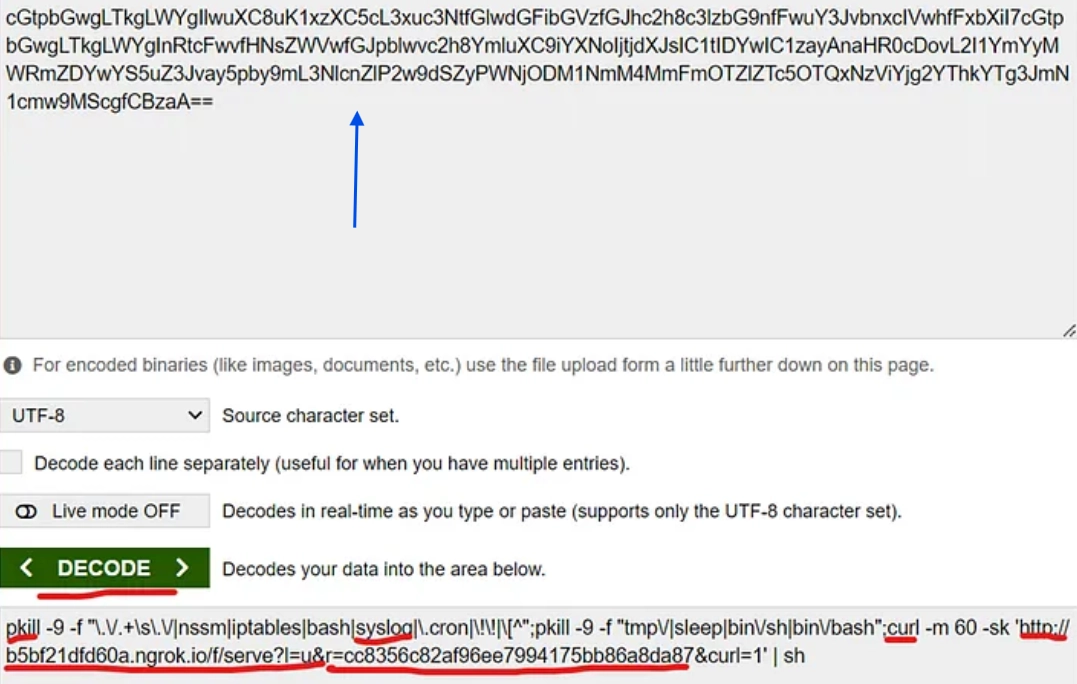
Source: Moore, Kevin9
Additionnaly, Splunk Enterprise Security offers a feature called “Log Observer Connect“, a cloud observability service, that allows you to pull log data from your Splunk Platform.
Graylog
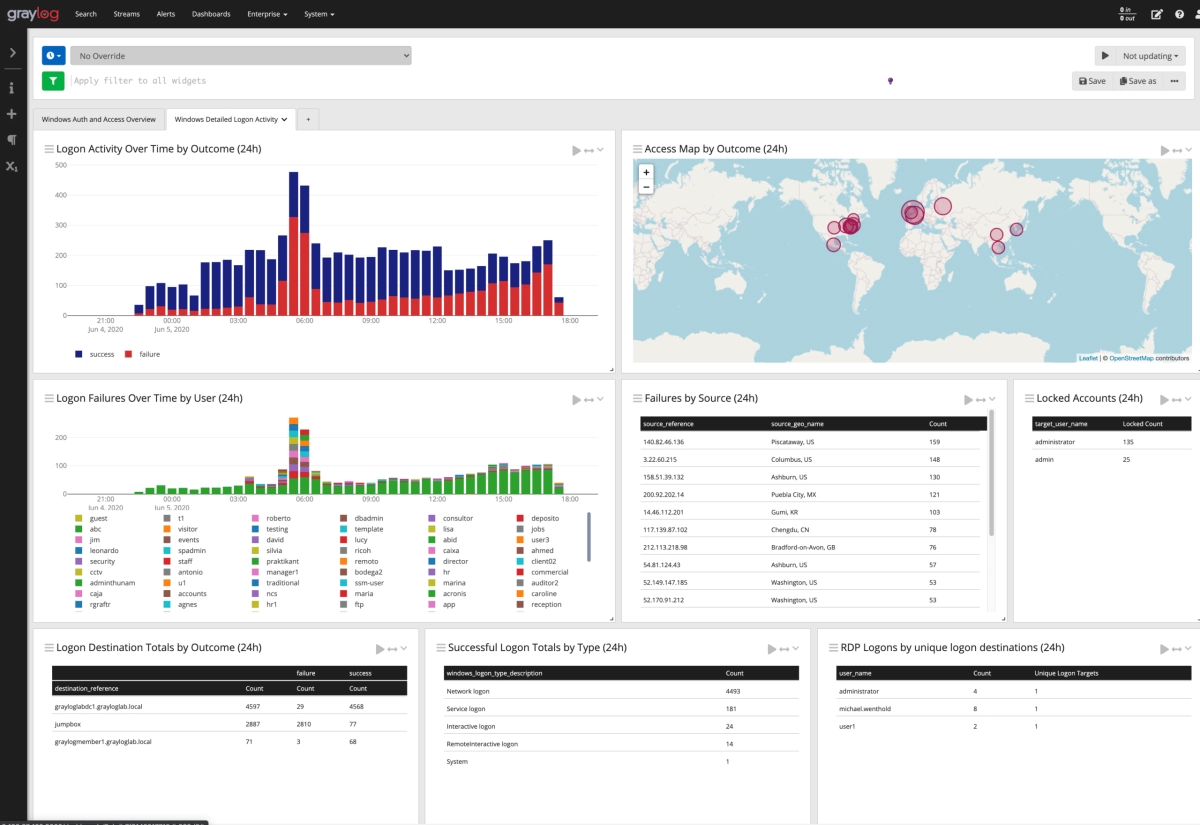
Graylog Enterprise offers log management for IT Operations and DevOps teams. The product also has integrations with Graylog Security SIEM for security & event management.
With Graylog users can utilize log analysis with charts and graphs to highlight relationships and similarities between events and data—for example, display endpoint events by event type. Users can also display event details (e.g. source, timestamp).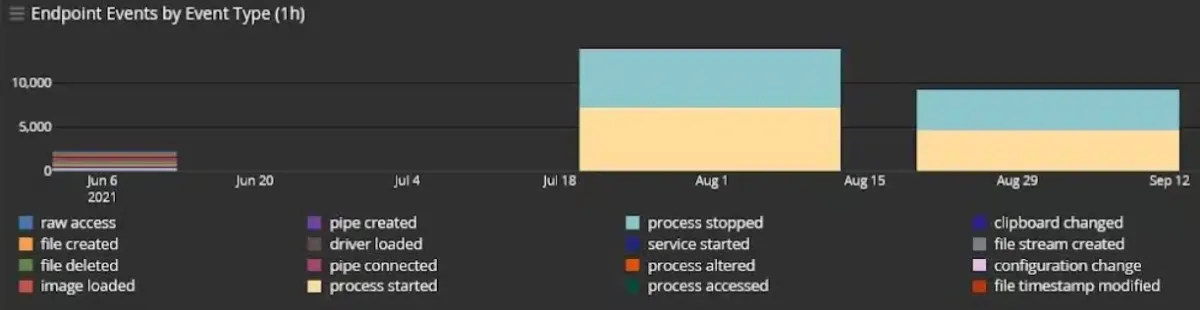
Source: Graylog Enterprise10
SolarWinds Observability SaaS
SolarWinds Observability SaaS is an observability platform used by DevOps, IT ops, and Cloud Ops teams. The product offers:
- Log Monitoring
- Application monitoring (specializes in Java application monitoring)
- Kubernetes monitoring
- Network monitoring
- Website monitoring
Offers database integrations for:
- MongoDB
- MySQL
- PostgreSQL
- Amazon Aurora
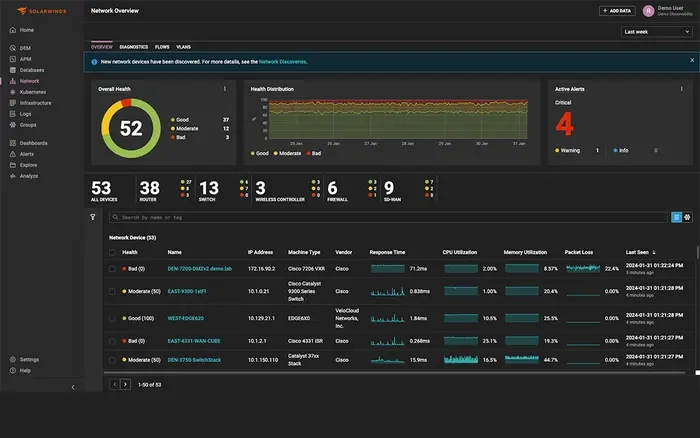
With SolarWinds Observability SaaS users can collect log data from websites, network devices, and virtual machines or AWS for centralized visibility.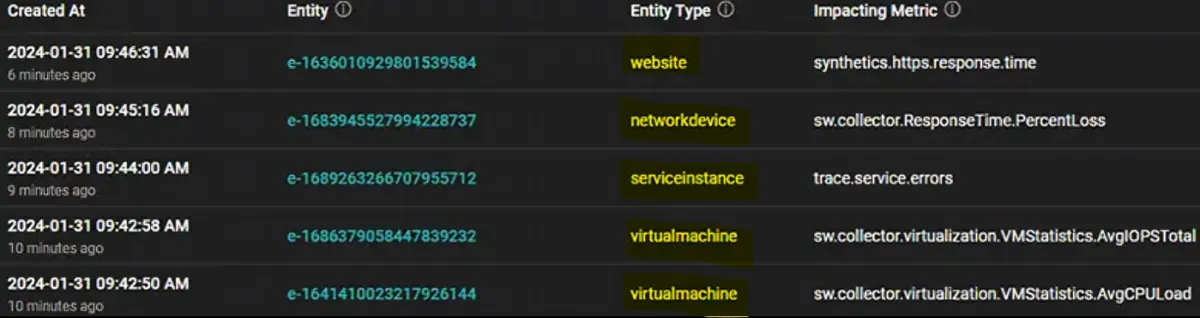
Source: SolarWinds11
Users can use the search box to find, filter, and analyze logs. Logs Explorer only shows logs that match the syntax.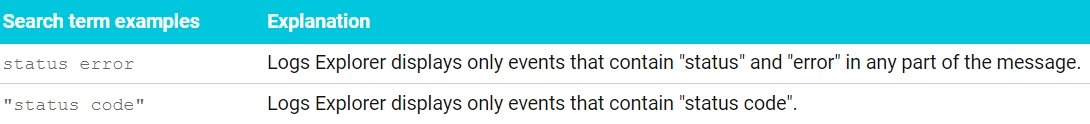 Source: SolarWinds12
For more detailed insights you can utilize the trends graph to reveal trends in the quantity of logs received at certain periods.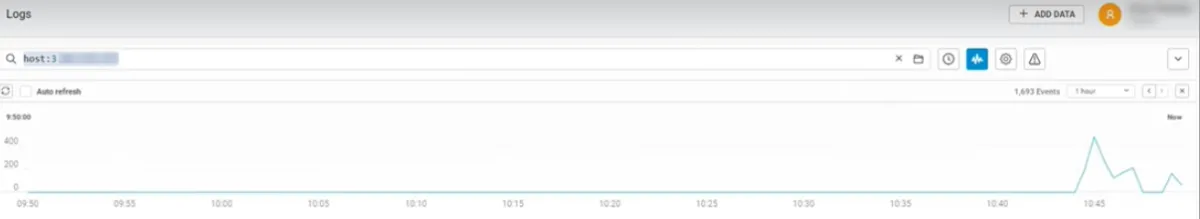
Source: SolaWinds13
Coralogix
Coralogix is a SaaS platform for log analysis, SIEM, and application performance management. Coralogix has 300+ integrations spanning monitoring, DevOps, security, collaboration, and cloud services:
- Monitoring and logging: Logstash, Prometheus, Fluent Bit, Kubernetes, Amazon CloudWatch, GCP Log Explorer, AWS Lambda, AWS S3
- Collaboration and communication: Slack, Microsoft Teams, JIRA
- CI/CD and DevOps tools: CircleCI, Jenkins, GitHub, OTel (OpenTelemetry)
- Security: CrowdStrike Falcon, Cortex XSOAR, PagerDuty
With Coralogix you can use lookup tables to convert these codes into meaningful explanations to increase your observability.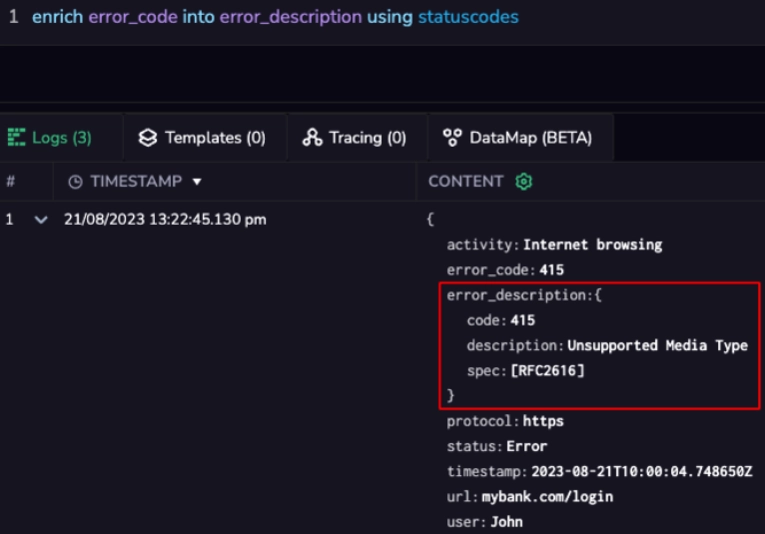 Source: Coralogix14
Moreover, with Coralogix analysts may get additional context by adding information from lookup tables directly into log entries. This helps detect unauthorized access with log lookup tables. For example, the lookup table can provide information on the cloud resource’s sensitivity level (based on AWS resource tags).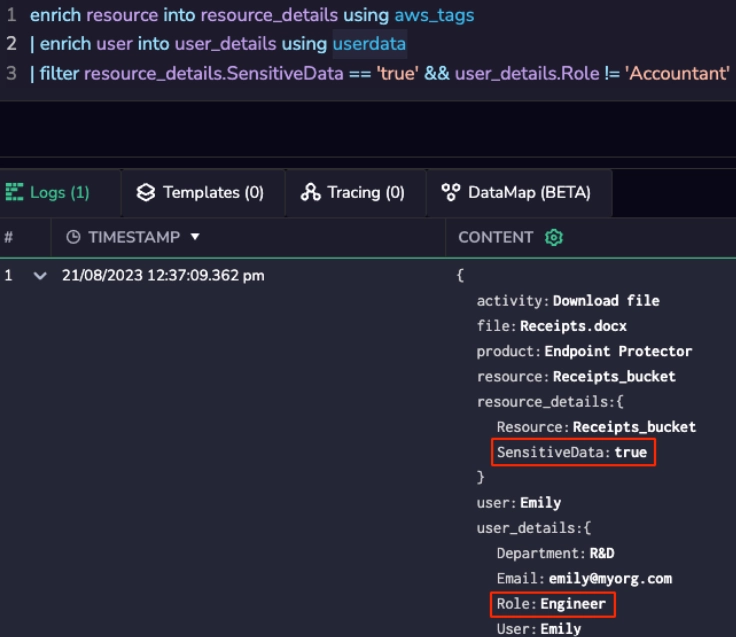
Source: Coralogix15
Log analysis methods
Log normalization
Log normalization involves converting logs from different formats into a consistent, standardized format. This allows for easier analysis and comparison across several systems and log sources.
For example, correlating access logs with error logs from specific IP addresses could help identify when an error occurs during a specific user’s session. This is especially critical for troubleshooting issues and tracing them to their root cause.
Pattern recognition
Pattern recognition helps identify anomalies or outliers. For example, if a system experiences a sudden traffic spike, pattern recognition could detect this deviation (e.g. a DDoS attack).
Log monitoring
Log monitoring automates the detection of anomalies in logs and provides real-time alerts. For example, log monitoring software could flag unusual login attempts, possibly indicating a brute force attack, or alert administrators to a spike in system errors caused by a software bug.
System performance analysis
System performance analysis examines logs to reveal system performance metrics like CPU usage, memory utilization, and network traffic. For instance, high CPU usage logs could reveal a need for resource optimization or network logs could point to bandwidth bottlenecks.
Vendor selection criteria
- Number of reviews: 100+ total reviews
- Average rating: Above 4.0/5
- Number of employees: 100+
FAQ
What is log analysis?
Log analysis is analyzing and recording log files to acquire information about a system’s behavior, performance, and security. To detect malicious activity, log analysis can employ a variety of approaches such as log correlation, forensic analysis, and cyber threat intelligence.
What is log analysis software?
A log analysis software needs to:
–Log collection: Gather log data from multiple sources, such as servers, applications, and databases.
–Centralized log management: Assist with mapping, categorization, and tagging logs in a centralized form.
–Log search and query capabilities: Allow users to search and filter logs.
Why do you need log analysis software?
The problem:
Analyzing and gaining visibility into system logs serves as the foundational tool for protecting your critical data and detecting abnormal activities.
However, merely ingesting terabytes of log data is futile without the right tools to efficiently parse, collect relevant log data, and detect anomalies.
How log analysis helps:
Effective log analysis enables you to know when and where to act, allowing for well-planned remediation strategies. While monitoring every IoT device on your network may be impractical, you can streamline your asset inventory and focus on the areas that matter most.
For instance, monitoring your most vulnerable areas allows you to gather threat intelligence for limiting gateway restrictions to limit data loss.
With log analysis you can also identify whether a malicious actor is moving laterally through your network by analyzing unusual login attempts, helping you minimize breaches.
Why do companies use log analysis?
Companies may use log analysis to find errors, trends, patterns, and anomalies, that can help you understand how your system works.
Various sources create logs, including operating systems, applications, databases, servers, and network devices. Each source has a unique format and structure for recording data. For example, web server logs will contain information regarding requests made to the server, such as:
-IP addresses
-Session ID
-Timestamps (encoded information identifying when a certain event occurred)
Log types
–Access logs: Every request made to a server is recorded in an access log, which includes information such as IP addresses, and timestamps.
These logs are critical for analyzing user activity, monitoring traffic trends, and detecting possible security issues. For example, a rapid rise in requests from a single IP address may signal a DDoS threat.
–Error logs: Error logs record incidents in which something went wrong with a system or application. This might involve lost files or crashing apps. Companies may examine such logs to identify errors and fix them before they escalate.
–Event logs: Event logs record major system events such as user logins, initialization, and configuration changes. Event logs can assist you in monitoring access requests.
Further reading
- Role-based Access Control (RBAC)
- Network Segmentation: 6 Benefits & 8 Best Practices
- 80+ Network Security Statistics
External Links
- 1. Gartner | Delivering Actionable, Objective Insight to Executives and Their Teams. Gartner
- 2. Bewertungen von Geschäftssoftware und -diensten | G2. G2
- 3. TrustRadius: Software Reviews, Software Comparisons and More. TrustRadius
- 4. Log360's Application log analytics- ManageEngine.
- 5. Log360's Application log analytics- ManageEngine.
- 6. LM Logs Overview | LogicMonitor. LogicMonitor
- 7. Log Analysis Tools | Datadog.
- 8. Get started with log management | New Relic Documentation.
- 9. Log Analysis Using Splunk. The incident response process is… | by Kevin Moore | Medium. Medium
- 10. What Is Log Management? A Complete Logging Guide. Graylog
- 11. Log Monitoring and Management Software | SolarWinds.
- 12. SolarWinds Observability | Logs Explorer.
- 13. SolarWinds Observability | Logs Explorer.
- 14. Lookup Tables and Log Analysis: Extracting Insight from Logs - Coralogix. Coralogix
- 15. Lookup Tables and Log Analysis: Extracting Insight from Logs - Coralogix. Coralogix


Comments
Your email address will not be published. All fields are required.