Application security metrics are essential for providing a clear, quantifiable overview of an organization’s security posture. They assist organizations on:
- informed decision-making,
- facilitating compliance,
- optimizing resources,
- reducing the risk of security incidents.
With 25% of all breaches directly coming from application vulnerabilities, monitoring security metrics is necessary. We highlight 10 metrics to help organizations measure, mitigate, and optimize their application security efforts.
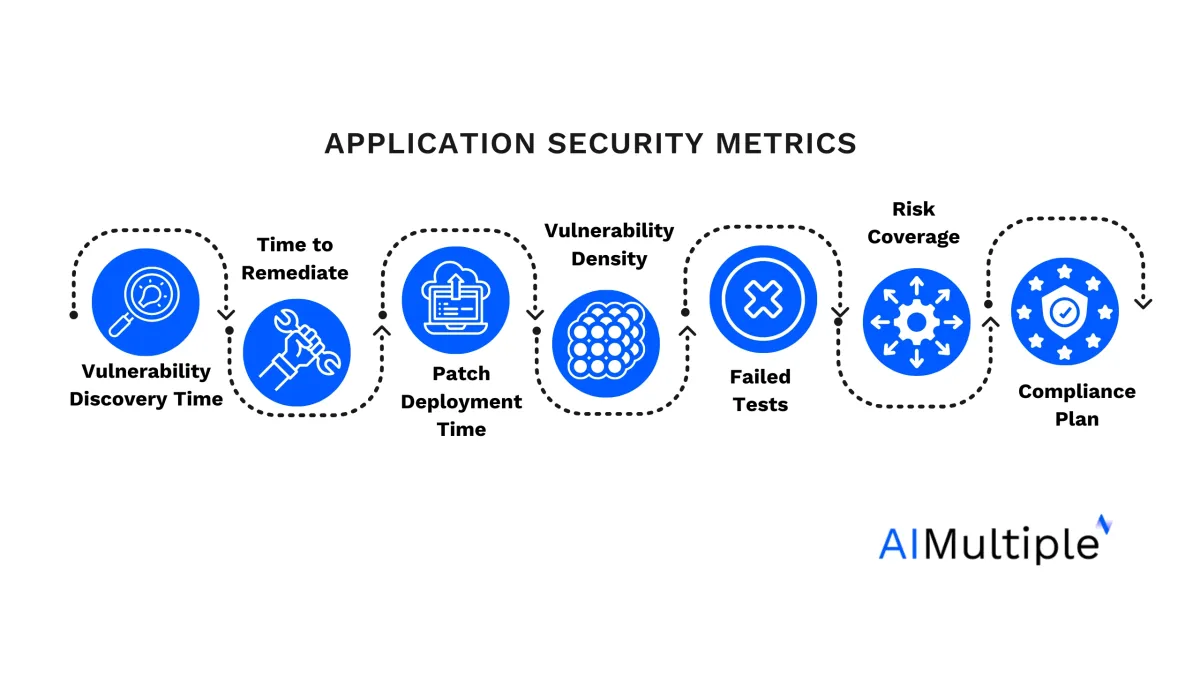
Top 10 Application Security Metrics
1. Vulnerability Discovery Time
Vulnerability discovery time measures the interval from when a new piece of code is deployed to when a vulnerability within that code is discovered. This metric is essential as over 75 percent of applications have at least one flaw in their systems when scanned.
Example: If a new feature is released on January 1st, and a vulnerability in this feature is identified on January 15th, the vulnerability discovery time is 14 days. This metric can highlight the effectiveness of the security testing processes; shorter discovery times may indicate robust testing protocols.
Various vulnerability management and scanning tools in the market can aid in vulnerability discovery; refer to our article for an in-depth analysis of the top vulnerability scanning tools
2. Time to Remediate
Time to remediate in the context of application security refers to the duration it takes to fix a security vulnerability from the moment of its discovery until the vulnerability is fully resolved. This metric is crucial for assessing the efficiency and effectiveness of an organization’s incident response and vulnerability management processes.
Example: A critical SQL injection flaw is identified on February 1st. The development team patched the vulnerability and deployed the fix on February 3rd. The time to remediate this vulnerability is 2 days. This metric is crucial for assessing the responsiveness of the development and security teams to security threats.
3. Patch Deployment Time
Patch Deployment Time, in the context of application security, refers to the duration it takes for a security patch to be applied to an application from the moment a vulnerability is identified and a patch is made available. This metric is crucial for understanding the responsiveness and agility of an organization’s security practices.
Example: After a vulnerability is fixed in the codebase on March 5th, the patch is tested, approved, and completely deployed by March 10th. The Patch Deployment Time is 5 days. This metric evaluates the efficiency and effectiveness of the deployment processes.
4. Vulnerability Density
Vulnerability Density is a metric used in application security to quantify the number of vulnerabilities within a codebase relative to its size, typically measured in lines of code (LOC). This metric provides insight into the security quality of the application’s code by indicating how many vulnerabilities are present per unit of code.
Example: If a codebase of 100,000 lines contains 50 known vulnerabilities, the Vulnerability Density is 0.0005 vulnerabilities per line of code. This metric helps in assessing the security quality of the codebase.
5. Failed Security Tests
This metric represents the percentage of automated security tests that fail during the development cycle.
Example: If 1,000 automated security tests are run and 100 fail, the Failed Security Tests rate is 10%. A high failure rate may indicate systemic issues within the development or security processes that must be addressed.
6. Risk Coverage
Risk Coverage is the ratio of identified risks that have been assessed and mitigated to the total identified risks.
Example: If 100 risks are identified and 90 have been fully assessed and mitigated, the Risk Coverage is 90%. This metric assesses how effectively the security team is managing and mitigating risks.
7. Vulnerability Severity Levels
This metric categorizes identified vulnerabilities based on their severity, often using ratings such as Critical, High, Medium, and Low. For example, a critical vulnerability might be a SQL injection flaw that allows an attacker to access and manipulate the database, while a low-severity issue might be a minor information disclosure that presents minimal risk.
Example:
- Critical: An SQL injection vulnerability that allows unauthorized database manipulation, potentially leading to data theft or loss.
- High: A buffer overflow vulnerability that could enable remote code execution by an attacker.
- Medium: An error message that reveals too much system information, potentially aiding attackers in crafting further attacks.
- Low: A minor issue like the exposure of software version numbers in web server headers, which could inform attackers but require significant effort to exploit.
Identifying the severity of vulnerabilities is essential because, in 61% of the examined applications, there was at least one high or critical severity vulnerability present that wasn’t listed in the OWASP Top 10.
8. Mean Time Between Failures
Mean Time Between Failures (MTBF) is a reliability metric predicting the time between inherent system failures during normal operation. It’s measured in hours and represents the expected uninterrupted system operation time. MTBF applies only to repairable systems, assuming fixability and return to operation after failures.
In application security, MTBF indicates the average time between significant security incidents or vulnerabilities causing disruptions. It reflects an application’s robustness and security against threats.
Example: Consider an online banking application that experiences security incidents, such as unauthorized access, data breaches, or DDoS attacks, leading to service interruptions. If, over a year, the application faced four significant incidents that caused the application to fail, you could calculate the MTBF as follows:
- Total operational time in a year = 365 days * 24 hours = 8,760 hours
- Number of significant failures = 4
- MTBF = Total operational time / Number of significant failures = 8,760 hours / 4 = 2,190 hours
9. Rate of False Positive/Negatives
The Rate of False Positives and False Negatives are critical metrics in the context of security systems, including application security, intrusion detection systems, and malware scanners. Both metrics relate to the accuracy and effectiveness of these systems in identifying security threats.
False Positives
A False Positive occurs when a security system incorrectly identifies a benign activity as malicious. This can lead to unnecessary alarms and potentially disruptive actions, such as blocking legitimate user access or quarantining safe files.
Example of False Positive:
Imagine an application security system that scans for SQL injection attacks. A developer inputs a test string that looks suspiciously similar to an SQL injection pattern but is actually a legitimate part of testing. The security system flags this as an attack attempt. Here, the action is benign, but the system’s response treats it as a threat, resulting in a false positive.
False Negatives
A False Negative, on the other hand, happens when a security system fails to detect an actual malicious activity, allowing it to proceed unchecked. This is more dangerous than a false positive because it means that real threats go unnoticed and can cause harm.
Example of False Negative:
Consider a malware detection tool scanning an application for threats. A new type of malware has been introduced into the application, but it’s coded in a way that doesn’t match the tool’s detection patterns. The tool fails to identify this malware as a threat, classifying it as safe. This oversight is a false negative, as the system missed a real security threat.
10. Compliance Plan
Compliance as an application security metric involves measuring how well an application adheres to specific security standards and regulations set by industry bodies, governments, or internal policies. It’s a way to ensure that applications maintain a baseline level of security, particularly in handling sensitive information and protecting against threats.
Example: An application that deals with health information in the United States must comply with the Health Insurance Portability and Accountability Act (HIPAA). Compliance, in this case, means implementing necessary security controls to protect health information, such as encryption, access controls, and audit trails. This ensures the application meets HIPAA’s requirements for privacy and security, serving as a metric to gauge the application’s security posture regarding healthcare data.
What are the tools for helping application security metrics?
Application security metrics are crucial for understanding an application’s security posture and guiding decisions for improvement. Several tools and platforms are designed to help with this, ranging from vulnerability scanning tools to application security tools.
- Static Application Security Testing (SAST) Tools: These analyze source code or compiled versions of code to identify potential security vulnerabilities without running the program.
- Dynamic Application Security Testing (DAST) Tools: DAST tools test applications from the outside, probing them while they run to identify potential vulnerabilities in an executing application.
- Interactive Application Security Testing (IAST) Tools: These tools combine aspects of SAST and DAST, working from within an application to identify vulnerabilities in real-time during testing or operation.
- Software Composition Analysis (SCA) Tools: These tools identify known vulnerabilities in open-source components and libraries used within an application.
- Vulnerability Scanning Tools: These tools help in the identification, classification, prioritization, and remediation of vulnerabilities.
- Cloud Security Posture Management (CSPM) Tools: For applications hosted in the cloud, these tools help identify and manage cloud-specific security risks.
Why are application security metrics important?

Informed Decision-Making
Security metrics provide quantitative data that can help stakeholders make informed decisions about where to allocate resources, which security tools to invest in, and which areas of their applications require the most attention. For example, 32% of security decision-makers adopted IAST in their development environments. This data-driven approach ensures that decisions are not based on assumptions or gut feelings but on actual performance and risk assessments.
Identifying Vulnerabilities
Metrics related to vulnerability discovery, density, and analysis findings enable organizations to identify application weaknesses. By tracking these metrics, organizations can prioritize vulnerabilities based on their severity and potential impact, ensuring that critical issues are addressed promptly. In 2023, the number of disclosed vulnerabilities reached an estimated 26,000.
Measuring Effectiveness of Security Measures
By tracking metrics such as Time to Remediate and Patch Deployment Time, organizations can gauge the effectiveness of their security protocols and incident response strategies. These metrics help assess whether the security measures are adequate and efficient in mitigating risks.
Compliance and Regulatory Requirements
Many industries are subject to regulatory requirements that mandate certain security standards and practices. Security metrics can provide evidence of compliance with these regulations by demonstrating that the organization is actively monitoring and improving its security posture.
Resource Optimization
Security metrics help organizations optimize their resources by highlighting areas that require more attention and those performing well. This allows for a more targeted allocation of resources, leading to cost savings and more effective security measures.
Risk Management
Metrics such as Risk Coverage and Mean Time Between Failures (MTBF) provide insights into the organization’s risk landscape and its ability to manage and mitigate those risks. Understanding and managing risks is fundamental to maintaining a strong security posture.
Continuous Improvement
Security is an ongoing process, and metrics provide a way to measure progress over time. Organizations can continuously refine and improve their security practices by tracking how metrics change in response to new security initiatives.
Stakeholder Assurance
Security metrics can be used to communicate with stakeholders, including customers, partners, and regulatory bodies, ensuring that the organization takes its security responsibilities seriously. This can enhance trust and confidence in the organization’s ability to protect sensitive data and maintain secure applications.
Benchmarking and Goal Setting
Metrics allow organizations to set benchmarks and goals for their security practices. Organizations can strive for continuous improvement and measure their progress against industry standards or past performance by establishing clear targets for metrics like time to remediate or incident response time.


Comments
Your email address will not be published. All fields are required.