We conducted a network monitoring benchmark, and based on the results, we identified the 10 network monitoring software options available. Discover our reasons for selecting each tool by clicking the links below:
| Software | For | |
|---|---|---|
1. | Monitoring network devices and traffic using customizable sensors. | |
2. | Large-scale SNMP-based network monitoring and performance tracking. | |
3. | Remote monitoring and management in managed service environments. | |
4. | Collecting and analyzing metrics across network and cloud infrastructure | |


See top network monitoring tools, assessment of their user experience, and their key features, such as CPU monitoring:
| Vendors | Price | Free Trial | Ratings | # of employees* |
|---|---|---|---|---|
| Paessler PRTG Network Monitor | Starting $ 1,810 | ✅ for 30-days | 4.6/5 based on 279 reviews | 364 |
| AKIPS | Not shared publicly. | ✅ for 30-days | 5/5 based on 4 reviews | 15 |
| Atera | $ 159 /month per host | ✅ for 30-days | 4.6/5 based on 749 reviews | 300 |
| Auvik | Not shared publicly. | ✅ for 14-days | 4.6/5 based on 266 reviews | 336 |
| Datadog | Starting $15 /month per host | ✅ for 14-days | 4.4/5 based on 675 reviews | 6,100 |
| LiveAction LiveNX | Not shared publicly. | ✅ for 14-days | 4.4/5 based on 6 reviews | 131 |
| LogicMonitor | Not shared publicly. | ✅ for 15-days | 4.5/5 based on 612 reviews | 1,000 |
| ManageEngine OpManager | Standard Edition: $245 [25 devices] Professional Edition: $345 [25 devices] Enterprise Edition: $11,545 [250 devices] | ✅ for 30-days | 4.6/5 based on 161 reviews | 302 |
| NinjaOne | Not shared publicly. | N/A | 4.8/5 based on 1,187 reviews | 909 |
| Solarwinds NPM | Not shared publicly. | ✅ for 30-days | 4.5/5 based on 290 reviews | 2,500 |
* Vendors are ordered alphabetically.
Vendor Selection Criteria
We narrowed down our network monitoring software comparison using three main factors:
- Number of employees: We looked at vendors with 15+ employees on LinkedIn.
- Number of user reviews: We gave preference to solutions with user reviews from the popular B2B review websites (such as G2 and Capterra), as it indicates a proven track record based on user experiences.
- Average review ratings: We selected the vendors with at least 4.4 points on average.
The Core Features of Network Monitoring Software
| NPM Software | SNMP polling interval | CPU monitoring | Device access control | Network topology mapping |
|---|---|---|---|---|
| AKIPS | 60 seconds | ✅ | ❌ | ❌ |
| Paessler PRTG Network Monitor | 60 seconds | ✅ | ❌ | ✅ |
| Atera | 300 seconds | ✅ | ❌ | ❌ |
| Auvik | N/A | ✅ | ❌ | ✅ |
| Datadog | N/A | ✅ | ❌ | ✅ |
| LiveAction LiveNX | 10 seconds | ✅ | ❌ | ✅ |
| LogicMonitor | 300 seconds | ✅ | ❌ | ✅ |
| ManageEngine OpManager | N/A | ✅ | ❌ | ✅ |
| NinjaOne | N/A | ❌ | ❌ | ❌ |
| Solarwinds NPM | 120 seconds | ❌ | ✅ | ✅ |
For definitions of the features mentioned above, please refer to the shared features of network monitoring tools section.
Review of Top 10 Network Monitoring Software
1. Paessler PRTG Network Monitor
Paessler PRTG Network Monitor is a network monitoring solution designed to monitor all aspects of an IT infrastructure. It provides real-time insights into network performance, system health, and various devices across the network.
Key Features
- PRTG includes a drag-and-drop map editor that allows users to create highly customizable network maps. These maps provide real-time insights into device status and network connections. Users can visualize entire network infrastructures, create hierarchical maps, and even overlay maps onto floor plans for easy device location tracking.
- Maps are interactive and dynamic, meaning they update automatically as network changes occur. This feature helps IT teams troubleshoot and monitor performance at a glance.
- PRTG provides monitoring, encompassing various aspects of IT infrastructure, including servers, virtual environments, bandwidth, and applications. It uses a variety of protocols, such as SNMP, NetFlow, and WMI, to gather data.
- The tool monitors network traffic, health, and performance, making it easier to detect and address issues before they escalate.
Pros:
- Ease of Installation and Configuration: PRTG is easy to install and configure, with a user-friendly interface that makes it simple to create visually appealing dashboards. It can be deployed and integrated in less than half a day, even without IT expertise.
- Ready-to-Use with Minimal Effort: The solution is designed for quick setup, with just a few clicks needed to get it up and running. This makes it highly suitable for businesses looking for a straightforward, out-of-the-box monitoring tool.
Cons:
- Scalability Limits in Free Version: The free version of PRTG is limited to monitoring up to 100 sensors, which may not be sufficient for larger networks, requiring an upgrade to a paid version for broader coverage.
- Resource-Intensive: PRTG can be resource-intensive, especially when monitoring a large number of sensors, which impact the performance of the monitoring server itself if not properly managed.
2- AKIPS
AKIPS focuses solely on network monitoring and performance improvement.
Key Features
- AKIPS includes a robust edge switch port mapper, which regularly conducts SNMP walks to map IP and MAC addresses to their associated switch ports. This allows for quick identification of edge ports and easy tracking of devices across the network.
- AKIPS gathers NetFlow records to provide detailed traffic paths, helping visualize which devices are communicating, which conversations are taking place, and pinpointing top talkers or listeners on the network.
- This feature uses SSH to log into devices and regularly crawl configurations, backing up data and allowing comparison across revisions. This is particularly useful for mapping out how configuration changes affect the overall network.
- 60-second polling ensures rapid updates across the network, keeping real-time data fresh and actionable.
Pros
- Ease of Setup and Use: Noted for its easy setup and the ability to integrate into various environments.
- Customization and Reporting: Offers customizable features and robust reporting capabilities.
Cons
- User Interface: The GUI is not very user-friendly, especially for non-technical users, and lacks an integrated network map (See Figure below).
You can have a free trial or contact AKIPS for their product.
3- Atera
Atera is a cloud-based IT management platform that integrates Remote Monitoring and Management (RMM), Professional Services Automation (PSA), and remote access, tailored for MSPs and IT professionals to streamline their operations and service delivery.
Key Features
- Real-Time Device Discovery: Automatically scans for new devices across domains and subdomains, continuously updating the list of devices and their statuses.
- Security Scans: Identifies potential vulnerabilities such as open ports and highlights devices that need patching or antivirus updates, minimizing security risks.
- Active Directory Integration: Monitors devices and users connected through Windows Active Directory, providing detailed reports on the OS, device status, and other metrics.
- Dynamic Reports: Atera provides clear, dynamic graphs and reports after scans, offering detailed insights into device types, operating systems, and overall health across the network.
Pros
- Ease of Implementation and Use: Atera is highly praised for its user-friendly platform and simple implementation process, making it accessible for users to deploy and integrate into their existing systems, including Microsoft Azure and UniFi platforms.
- IT Management and Monitoring: Users appreciate Atera’s extensive functionality, which includes remote monitoring and management (RMM), automated ticketing, alerts, and integration with various applications.
- Cost-Effectiveness and Support: Particularly for non-profit and smaller organizations, Atera’s cost structure is highlighted as a major benefit. The platform offers a good value proposition, complemented by responsive and helpful customer support.
Cons
- Feature Limitations and Reporting: While Atera is lauded for its many features, some users note limitations in specific areas such as detailed reporting and analysis. The reports generated by Atera are reportedly lacking depth, making it challenging for IT teams to perform comprehensive analyses. Additionally, the platform’s ticketing system and support functionality could be improved to enhance user experience and operational efficiency.
4- Auvik
A cloud-based network performance monitoring software, Auvik is known for its automated setup, network mapping, and resource utilization alerts. It’s especially effective for multi-site businesses, offering traffic analysis features in its higher plan.
Key Network Mapping Features:
- Automated Discovery: Auvik automatically scans the network using protocols like SNMP, CDP, and LLDP to identify all devices and map out connections. This eliminates the need for manual mapping and ensures the maps stay current as the network evolves.
- Multi-Layer Mapping: Auvik maps out Layer 1 (physical) and Layer 2/3 (logical) connections, providing insights into how devices are interconnected. This is particularly useful for troubleshooting and understanding network structure.
- Customizable Maps: You can apply filters to declutter the maps, making viewing specific segments or connections easier. Auvik also allows for the toggling of views such as VLAN topology and clustered topology, helping visualize different network performance aspects.
- Real-Time Alerts on Maps: Alerts for network issues are overlaid directly on the network map, allowing you to immediately see where problems are occurring and access device details for troubleshooting.
- Exportable Maps: Maps can be exported in formats like PDF or SVG, enabling easy sharing or documentation.
Pros
- Network Visualization: Users appreciate the comprehensive and intuitive network mapping and real-time diagrams.
- Ease of Implementation and Use: Auvik is lauded for its easy setup, intuitive interface, and integration with various network devices and platforms.
- Valuable Insights and Documentation: It provides crucial insights into network topology, improving documentation and troubleshooting for technicians.
Cons
- Complexity and Alert Overload: Some users find Auvik feature-rich and complex, leading to difficulty in navigating and managing the abundance of features and alerts.
Datadog is a monitoring and analytics platform that provides visibility into the performance and security of cloud-scale applications by aggregating data from servers, containers, databases, and third-party services.
Key Features
- Live Network Maps: Datadog automatically generates a live, interactive map that visualizes the entire network topology. This map helps identify network partitions, dependencies, and bottlenecks by visualizing the connections between hosts, containers, services, and virtual networks.
- Network Flow Monitoring: The platform captures and analyzes Layer 3 network traffic, giving insights into how data moves between devices, VMs, containers, and even serverless functions.
- Tag-Based Grouping: Datadog’s unique tagging system allows users to filter and group network traffic by any label, such as service, role, or availability zone, rather than relying solely on IP addresses.
- Application and Network Integration: Datadog consolidates network, application, and infrastructure monitoring into one platform.
Pros
- User-Friendly Interface and Ease of Use: Multiple reviews highlight Datadog’s user-friendly interface, ease of navigation, and simplicity in setting up monitors, dashboards, and alerts. This makes it accessible for users to manage and monitor their services and infrastructure effectively.
- Monitoring and Real-Time Insights: Reviews constantly mention Datadog’s ability to provide real-time visibility into the performance of applications, infrastructure, and logs. Its comprehensive monitoring tools, including log management, APM, infrastructure metrics, and more, allow for effective troubleshooting and performance optimization.
- Integration: Datadog is praised for its seamless integration with a wide range of other applications and services, enhancing its utility in diverse IT environments.
- Customization Capabilities:The platform’s customization options, particularly in dashboard and metric configurations, are also highlighted as a significant advantage, allowing users to tailor the tool to their specific monitoring needs.
Cons
- Costs: A recurring theme in the reviews is the concern over Datadog’s pricing, which some users find to be relatively high compared to other similar tools.
- Documentation Challenges: Additionally, the complexity and breadth of the documentation, along with the steep learning curve for new users, are mentioned as drawbacks.
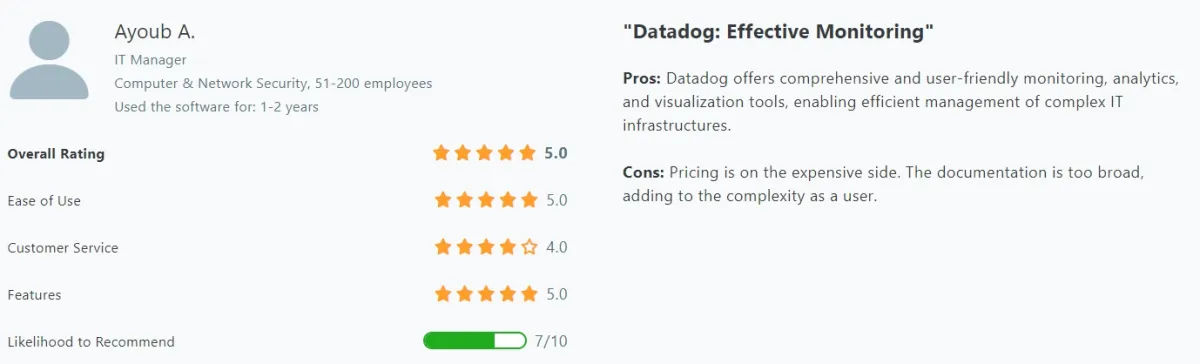
Figure 4. User review on Datadog
Source: Capterra1
6- NinjaOne
NinjaOne is a unified IT operations platform that includes a network performance monitoring solution. It is known for its user-friendly interface and comprehensive feature set, which includes remote monitoring and management (RMM), patch management, and backup tools.
Key Features
- Network Mapping & Device Discovery: NinjaOne’s platform automatically discovers network devices through its discovery wizard, which scans the IP range of your network. The system supports SNMP v1, v2, and v3, allowing the automatic identification of new devices like routers, switches, and firewalls.
- NetFlow Integration: NinjaOne simplifies network troubleshooting with NetFlow monitoring, providing insights into top conversations, applications, and bandwidth usage. This feature allows you to monitor traffic patterns and detect bottlenecks in real time.
- Real-Time Network Visibility: NinjaOne provides a single-pane-of-glass view of all devices on your network, allowing IT teams to monitor network health, receive alerts, and access historical data to improve decision-making.
Pros
- Ease of Setup and Use: Users appreciate NinjaOne’s straightforward setup process and simple yet effective scripting capabilities.
- Effective Integration and Support: The tool is noted for its robust integrations and responsive customer support, including dedicated account managers.
- Monitoring and Management: Provides valuable insights and control over the entire network infrastructure, with features like remote desktop functionality and patch management.
Cons
- Complexity in Automation and Reporting: Some users find the automation features less intuitive and express a desire for more comprehensive reporting capabilities and script integrations (see Figure below).

Figure 5. User review on NinjaOne
Source: G22
7- Site24x7 (ManageEngine)
Site24x7 is a cloud-based, all-in-one monitoring solution designed to ensure the availability and performance of websites, online applications, servers, and internet services.
Key Features
- Automatic Device Discovery: Site24x7’s mapping tool automatically discovers network devices using IP ranges and SNMP protocols, eliminating the need for manual input. This allows for a real-time view of the network with dynamic updates as new devices are added or removed.
- Layer 2 and Topology Maps: It provides both Layer 2 maps and topology maps. Layer 2 maps focus on device connections and interfaces, helping you identify and monitor all devices within your network, including unauthorized or unmonitored ones. Topology maps, on the other hand, offer a more hierarchical view, visually organizing devices and their relationships.
- Dependency Mapping: Site24x7’s mapping tool also visualizes dependencies between network devices, which helps identify potential impact areas when changes occur. This feature aids in troubleshooting by showing how issues in one part of the network might affect others.
Pros
- Ease of Integration and Deployment: Users appreciate the platform’s ease of integration with existing infrastructure and the straightforward deployment process. The availability of necessary plugins out-of-the-box and compatibility with different IT equipment enhances the user experience by simplifying the setup.
- Cost-Effectiveness: Many reviews highlight the attractive price point of Site24x7, especially for smaller installations. Users feel that the service offers good value for money, allowing for extensive monitoring capabilities without a significant financial burden.
Cons
- Complexity and Documentation Issues: Some users find the platform overwhelming due to the sheer number of options available. The complexity is compounded by documentation that is sometimes lacking in clarity, particularly regarding manual configurations and advanced features. This can make it challenging for users to fully leverage the platform’s capabilities or customize it to their specific needs without additional guidance or support (see Figure below).
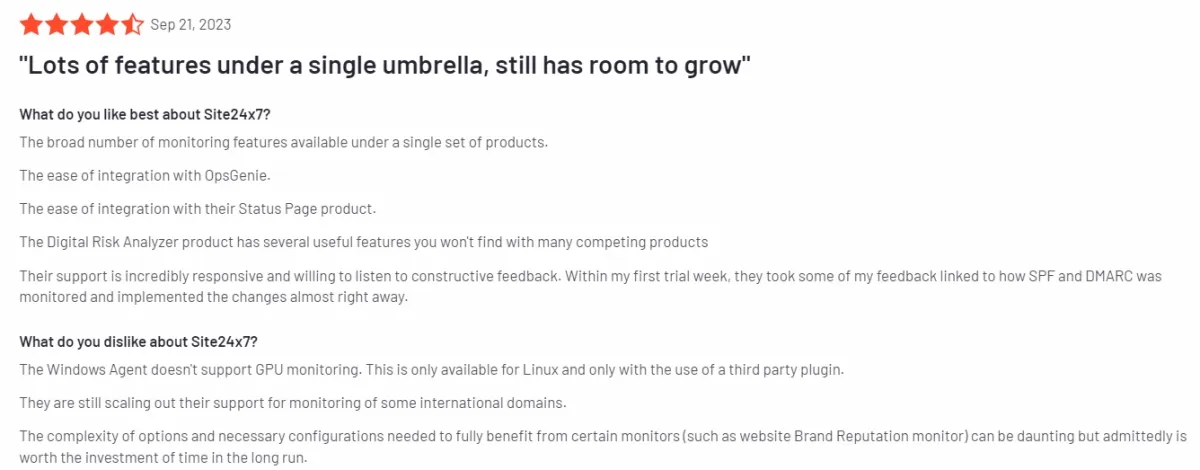
Source: G23
8- Solarwinds NPM
Solarwinds NPM features SNMP monitoring, automatic device discovery, network packet analysis, and intelligent network maps.
Key Features
- Orion Maps: NPM uses Orion Maps, which dynamically display network devices, connections, and real-time performance metrics.
- Layer 2 and 3 Mapping: NPM can create Layer 2 and Layer 3 maps, allowing visibility into both physical and logical connections within the network.
- NetPath: A unique feature of NPM is NetPath, which visually traces the hop-by-hop network paths that packets take across on-premises, hybrid, and cloud environments.
- Automatic Discovery and Alerts: NPM’s network mapping is driven by automatic discovery via SNMP, WMI, and ICMP protocols.
Pros
- User-Friendly Interface: The tool is commended for its intuitive UI, making it accessible even to less experienced engineers.
- Monitoring Capabilities: Offers a wide range of functionalities including SLA, performance, ICMP, SNMP monitoring, config backup, and effective traffic graphs (see Figure below).
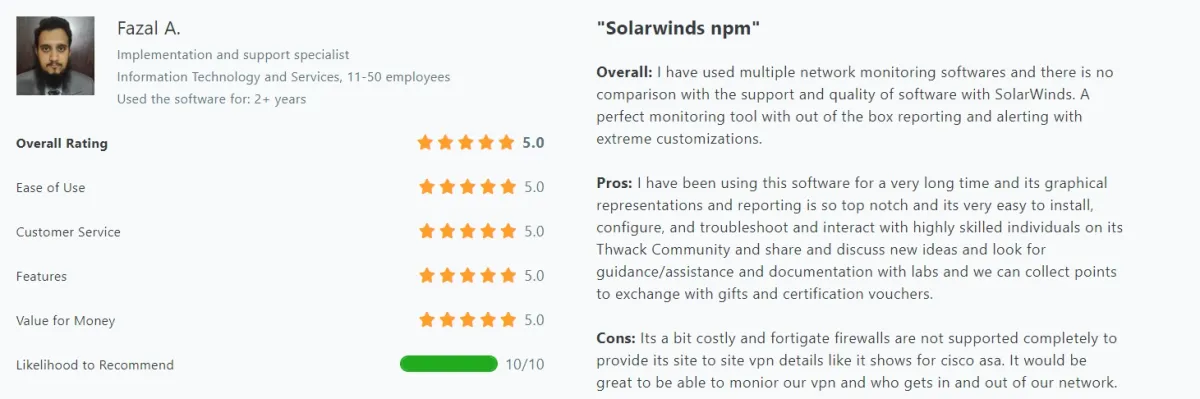
Figure 7. User review on Solarwinds NPM
Source: Capterra4
Rich Feature Set: Known for its excellent event alerts and extensive out-of-the-box templates, especially for application monitoring.
Cons
- Cost and Complexity: The most common drawback noted is its high price point, along with the complexity and resource requirements for setup and integration, especially in initial stages.
Shared Features of Network Monitoring Tools
The core job of a network monitoring tool is to continuously observe a computer network for any issues such as slow or failing components, and to alert the network administrator in case of outages or other trouble. For this, there are 2 core features of a typical network monitoring tool:
- Network Discovery: Network discovery helps administrators understand the layout of the network, including routers, switches, firewalls, and endpoints. This process is often the first step in network monitoring, as it provides a comprehensive view of the network’s architecture.
- Network Traffic Monitoring: Traffic monitoring helps in understanding the performance of the network, identifying the types of traffic (e.g., email, web, video streaming), and pinpointing potential bottlenecks or unauthorized traffic. It’s crucial for ensuring optimal network performance and security.
All of the tools included in our list satisfy these 2 core criteria. After this, there are other optional yet important features, such as:
- SNMP polling interval: SNMP is a system used for monitoring and managing network devices. It indicates how often the SNMP manager will make a request for information from the SNMP agents on parameters such as CPU loading, network loading, and device status.
- CPU Monitoring: This is the procedure in which a device’s CPU activities are taken through monitoring and analysis. It is of importance to an administrator in that, with this information, one is able to identify the issues in performance, the bottlenecks of the resources, and potential failures that may be realized by watching CPU use over time.
- Device access control: This involves access to network devices management and regulation in the context of security and policy. Basically, implementation of device access control measures would ensure that unauthorized access is prevented, sensitive information is safeguarded, and the integrity of the network infrastructure is well maintained.
- Network topology mapping: A network topology map graphically depicts network devices and links and shows the relationship between them, allowing administrators to view the network layout, see problems that may arise, and look forward to enhancements. Network topology maps help in visualizing the network infrastructure, troubleshooting problems, and optimizing performance.
Another important capability of a network monitoring software is tracking key performance indicators. These include:
- Latency
- Bandwidth utilization
- Packet loss
- Jitter
Moreover, a vital feature to consider in a network monitoring software is performance-focused device monitoring. It uses a variety of techniques, including:
- SNMP alerts
- Event logs
- Syslog triggers
- Flow-based monitoring
This provides the best network device monitoring software for network monitoring, including network performance monitoring software, free network monitoring software, and network monitoring solutions.
Choosing the Right Network Monitoring Service
Choosing the right network monitoring software involves considering factors such as:
- Monitoring capabilities
- Scalability
- Flexibility
- Integration potential
- Overall usability
To ensure efficient operations, selecting network device monitoring software equipped with an intuitive, customized dashboard is vital. This includes features like network topology maps, status reports, and options for troubleshooting. The implementation process should be straightforward to avoid disruptions during setup. The service should also offer real-time, actionable reports for rapid issue resolution.
The productivity and security of the monitoring system are optimized through role-based access control. It delegates permissions according to the functions of users in the organization, ensuring only authorized personnel can make changes. Lastly, the choice between a free, open-source network monitoring software and a paid solution with extensive features will depend on the organization’s requirements. This decision should be based on the size and complexity of the network and the resources available for managing it.
FAQs
What is network monitoring software?
Network monitoring software gathers and analyzes network data to provide administrators with information on the network’s status, performance, and potential issues. It helps in maintaining optimal connectivity and identifying internal network problems or anomalies.
For more on network monitoring
- Network Performance Monitoring to Maximize Business Efficiency
- Top 5 Network Performance Monitoring Tools
- 10 Network Performance Best Practices to Improve Network Optimization
- 26 Network Performance Metrics to Measure Network Health
Transparency Statement: AIMultiple works with B2B tech vendors, including Paessler PRTG and AKIPS. Vendors with links are among AIMultiple’s sponsors.


Comments
Your email address will not be published. All fields are required.