Top 15 Circular Economy Metrics to Assess Businesses
The concept of circular economy (CE) is quickly making its way into business literature since we are struggling with major environmental issues. Besides its environmental value, CE expects to bring 4.5 trillion dollars until 2030 due to effective allocation of resources.1
Since the circular economy (CE) concept is relatively new to many corporate agendas, executives may be uncertain about which circular economy metrics to report. Explore 15 key metrics for assessing corporate circularity:
Materials and resource use indicators
1. Resource Productivity
Definition: Evaluates how efficiently a company uses raw materials to generate economic output.
Figure 1. The formula of resource productivity
Why: Higher productivity indicates that a company generates more value per unit of virgin material, reflecting stronger circularity and reduced material waste. Tracking this indicator allows businesses to measure progress toward resource efficiency targets.
2. Percentage of recycled material used
Definition: Share of materials coming from recycled or renewed sources in production.
Figure 2. Formula of percentage of recycled materials
Why: A higher percentage shows effective material loops and reduced dependency on virgin resources. This indicator supports circular business models and helps companies reduce environmental impacts.
3. Percentage of product recyclability
Definition: Share of a product that can be reused or recycled after use.
Why: High recyclability strengthens circular transition indicators by enabling companies to track progress in waste management and resource efficiency.
Deposit refund systems can motivate customers to return used products by offering a financial reward.2 This not only boosts recycling rates but also ensures that businesses maintain a focus on extending product lifecycles, a key component of circular economy frameworks.
4. Percentage of circular water consumption
Definition: Share of water reused instead of being consumed as freshwater.
Figure 3. Percentage of circular water consumption formula
Why: Supports resource efficiency and aligns with circular economy principles. It also addresses climate change and water scarcity concerns by reducing reliance on fresh water. With demand for water projected to exceed supplies by 40% by 2030, reusing treated wastewater is an essential circular transition indicator.3 Already, 35% of the global population lacks access to safe drinking water.4
5. Percentage of circular water discharge
Definition: Proportion of discharged water suitable for reuse.
Figure 4. Percentage of circular water discharge formula
Why: Encourages circular business models and promotes environmental sustainability, contributing to resource efficiency across sectors.
To achieve this, businesses must invest in facilities that treat water to a level suitable for reuse. This aligns with environmental standards like GRI 306, which provide guidance on water discharge and reuse practices, helping companies reduce their overall environmental footprint.5
6. Percentage of recyclable energy consumption
Definition: Share of energy from renewable or circular systems.
Why: Tracking this metric helps companies reduce reliance on fossil fuels, mitigate climate change, and advance circular transitions.
Real-life example: The U.S. Environmental Protection Agency (EPA) tracks the renewable energy consumption of retail enterprises, with many businesses aiming to increase their use of renewables to meet sustainability targets.6
Figure 5. Percentage of renewable energy consumption formula
Product and component indicators
7. Repairability of product
Definition: Measures how easy it is to repair a product to extend its life.
Why: Higher repairability supports resource efficiency, reduces waste generation, and strengthens the business case for circular business models.
8. Warranty period
Definition: Acts as a proxy for durability and circularity.
Why: Longer warranties encourage reuse and repair, signaling confidence in product longevity. Companies can use this metric to monitor progress toward more sustainable circular business models.
Real-life example: Waterhaul, a sunglasses manufacturer, offers a lifetime warranty on its products, which are made from recycled materials like ghost fishing nets.7 This not only demonstrates the company’s commitment to sustainability but also encourages consumers to use products for longer, reducing waste generation.
9. Longevity indicator
Definition: Measures the average lifespan of products based on records or expert assessment.
Explanation: Longer lifespan means materials stay in use longer, which reduces waste generation and supports sustainable circular business models. Consumer behavior can influence this metric.
10. Material circularity indicator (MCI)
Definition: Combines inputs of virgin and recycled materials, product lifespan, and unrecoverable waste into one index.
Explanation: MCI allows companies to assess circularity quantitatively. Higher scores indicate stronger circular business models and resource efficiency.
11. Estimated environmental saving of rentals
Definition: Reduction in environmental impacts from leasing or sharing products instead of producing new ones.
Why: Leasing and sharing extend product lifecycles, reduce waste, and improve resource efficiency, supporting circular transition indicators.
Function and service indicators
10. Eco-costs value ratio (EVR)
Definition: Ratio linking environmental burden to economic value.
Figure 6. Formula of Eco-costs value ratio (EVR)
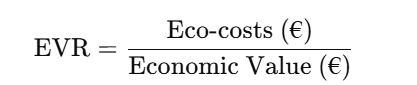
Why: Lower EVR indicates less environmental impact per economic output. It supports measuring circularity for service-based models.
11. Circular transition framework
Definition: Qualitative roadmap for implementing circular business models and services.
Why: Provides step-by-step guidance for circular transition, helping companies prioritize actions and monitor progress.
12. Material flow analysis (MFA) + Sankey diagrams for functions
Definition: Tracks how resources flow into societal functions (housing, mobility, healthcare, etc.).
Figure 7. Material Flows on the Island of Hawai
Source: Material flows on the island of Hawai’i8
Why: Shows whether functions are delivered with more recycled or circular resources, supporting circular economy metrics at a system level.
Overall progress and organizational circularity indicators
13. Progress towards goals
Definition: Tracks performance against CE targets.
Why: Helps companies measure progress, align with European Commission guidance, and communicate achievements in resource efficiency and sustainability.
Real-life example: Clothing retailer H&M provides an example: through its “Let’s Close the Gap” initiative, the company aims to use 100% sustainable raw materials by 2030. By 2019, it had already achieved 57%, showing measurable progress toward its circularity goals.9
14. Circle assessment
Definition: Structured self-assessment tools evaluating operational and organizational circularity.
Why: Offers insights for prioritizing interventions, monitoring progress, and improving circular business models.
15. Circularity gap metric
Definition: Composite indicator combining scarcity, recyclability, and geopolitical availability of materials.
Figure 8. Visual representation of the circularity gap
Source: Circle Economy10
Why: Highlights inefficiencies in material loops, supports waste management, and provides a macro-level view of circular transition progress.
While the Circularity Gap Metric provides a high-level overview, it can be complemented by other tools such as Circulytics11 or Circular Transition Indicators12 (CTI) to gain deeper insights into specific interventions required to enhance circularity within a company or its product lines.
Practical guidance for businesses: detailed approach
Implementing circularity metrics effectively requires more than simply tracking numbers. Businesses need structured strategies to monitor progress, make informed decisions, and support a genuine circular transition. Below is a more detailed guide to applying these indicators:
1. Use a mix of metrics
No single metric captures the full picture of circularity. Companies should combine:
- Material indicators (e.g., % recycled material, resource productivity) to track resource loops.
- Product indicators (e.g., repairability, warranty period, product recyclability) to measure durability and reuse potential.
- Functional/service indicators (e.g., EVR, MFA-based functional preservation) to assess how services replace products sustainably.
- Organizational indicators (e.g., circle assessment, circularity gap metric) to capture company-wide practices.
Using a mix ensures that progress is measured across multiple dimensions and helps avoid blind spots in waste management and resource efficiency strategies.
2. Track both quantity and quality
Metrics should include:
- Quantitative measures like material mass, recycled content, and energy consumption. These provide clear numbers to monitor progress.
- Qualitative measures such as product lifespan, functional performance, or ecological value of reused materials. These capture consumer behavior impacts and material quality, which are often overlooked in mass-based metrics.
Balancing quantity and quality helps businesses assess the effectiveness of circular business models and make informed decisions about product design, reuse, and repair strategies.
3. Follow consistent methodologies
Consistency is crucial for comparability and benchmarking. Use established methods such as:
- Life Cycle Assessment (LCA): Evaluates environmental impacts of products or services across their lifecycle.
- Material Flow Analysis (MFA): Maps resource flows to identify inefficiencies in material loops.
- Material Circularity Indicator (MCI): Integrates mass, lifespan, and waste to provide a single circularity score.
Consistent methodologies allow businesses to compare performance over time, evaluate progress toward circularity targets, and generate credible insights for stakeholders.
4. Link metrics to targets
Setting clear, measurable targets ensures metrics are actionable. Companies should:
- Define goals for resource efficiency, such as reducing virgin material use or increasing recycled content.
- Set waste reduction targets, including minimizing non-recoverable waste and improving product recyclability.
- Align internal KPIs with circular transition objectives and European Commission guidance, ensuring that performance is tracked consistently across departments.
Linking metrics to targets transforms data into a tool for decision-making, strategy refinement, and reporting progress.
5. Monitor trade-offs
Circular strategies may have unintended consequences. For example:
- Recycling low-quality materials may sometimes have higher environmental impacts than energy recovery.
- Extending product lifespan may require more durable materials with a higher initial environmental footprint.
Businesses need to analyze trade-offs between environmental impacts, resource efficiency, and economic feasibility. Using composite indicators, scenario analysis, and life-cycle thinking can help identify optimal circular strategies.
6. Communicate clearly
Transparent reporting is essential for stakeholder engagement and internal accountability. Companies should:
- Use composite indices (e.g., SCI, MCI) to summarize complex performance data in an understandable format.
- Provide explanations of assumptions, data sources, and methodology to maintain credibility.
- Regularly report progress toward circularity goals in sustainability reports or dashboards, enabling stakeholders to see the impact of circular business models.
Clear communication ensures that metrics are actionable, comparable, and support the business case for circular transition, while fostering organizational commitment to sustainable practices.
Advantages of measuring circularity of firms
1. Enables development of a circular economy strategy
Measuring circularity allows businesses to identify inefficiencies in their resource consumption and waste management systems, enabling the design of targeted plans to address these challenges. Circular economy metrics provide valuable insights for optimizing resource efficiency by leveraging innovation and technology, leading to enhanced operational performance and sustainability.
2. Promotes proactive business practices
There is evidence highlighting the growing awareness among investors, customers, and other stakeholders regarding environmental, social, and governance (ESG) issues.
- Recent market research indicates that %46 of customers prefer to buy “more sustainable products or products with a reduced climate effect” while shopping.13
- The value of firms can be determined by the investment community, which prefers ESG investing by prioritizing ESG initiatives and data of firms while making investments.14
Using consistent circular metrics and comparing regular reports helps communicate achievements effectively, demonstrating progress towards sustainability goals.
3. Support certification achievements
Certificates like Cradle to Cradle (C2C) rely on firms measuring circularity to meet high circular economy standards.15 Companies can enhance key areas based on circular transition indicators, making progress towards earning such certifications by evaluating and improving their practices.
4. Assess the legal cost of business practices
With increasing climate change regulations, such as extended producer obligations and plastic taxes, companies must track their circularity to remain compliant. Measuring circularity helps businesses anticipate legal costs and adapt to evolving frameworks, like those introduced by the European Commission, ensuring they meet sustainability requirements.
Carbon footprint is another metric firms need to assess to see their progress towards net zero. To automate the measurement process you need a carbon footprint calculator. Read Top Carbon Footprint Software/Tools for Businesses if you are interested in the carbon footprint software.

Be the first to comment
Your email address will not be published. All fields are required.