Top 9 Metrics for Software Testing Efficiency in 2024
The cost of software bugs in the production stage can be high; testing must be done to detect them. However, testing is not cheap; it is estimated that testing can take up to 25% of a project’s total cost. Given the high cost of testing, it becomes essential that your tests be efficient and effective.
Predetermined metrics can help companies to assess the quality of their software testing. Therefore, this article will look at the Top 9 software testing metrics and their formulas to help QA testers.
Why is testing measurement important?
Testing measurement is a continuous cycle (Figure 1), and it is important because it allows:
Figure1) Test measurement life cycle

Source: GeeksforGeeks
- Real-time monitoring
- Monitor productivity
- Identifying areas that require attention
- Measuring changes
- Measuring software quality changes
Testing measurements should be done for both manual and automated tests. Automated tests increase testing speed, coverage, and accuracy. For more on automated testing, read Automation Testing: Types, Frameworks, Tools & Best Practices.
Sponsored
Testifi is a test automation tool provider trusted by many Fortune 500 companies such as Nokia, Amazon, and BMW. They provide API & web testing tools through their CAST tools with tracking and real-time performance dashboards.
We will continue with different types of software testing metrics.
Absolute numbers
Absolute numbers are one-dimensional metrics. They have interpretation limitations due to their absoluteness. They are most used in other metrics to create derived metrics. 2 of the notable metrics in this category are:
1- Total Test Duration
This metric measures the time it takes to conduct tests. Ideally, you want the test duration to be low, as it will mean that you can run more tests. This is important because in an agile development system, many iterations are made, and if testing takes a long time, it will decrease the development speed and can cause developers to test less, which can lead to higher bugs and problems down the road. The downside of this metric is that it does not show the quality of the test.
2- Total number of defects
It measures how many defects exist in each iteration. This allows comparison among different versions.
All of the following metrics are derived metrics.
Tracking & efficiency
The following measures help QA teams to understand the efficiency of their testing and track their progress against their goals and milestones. However, these ratios do not provide information about the quality and coverage of a test.
3- Test passed percentage
It is an overview of the testing progress. It can be powerful when used in combination with defect KPIs. For example, if the defect escape ratio is high and the test passed percentage is high it can mean that tests are not covering important areas. ( see Figure 2)

4- Fixed defects percentage
It indicates how many of the defects found were fixed. ( see Figure 3)
Figure 3

Test effectiveness
Test effectiveness ratios are quality tests. They measure the effectiveness of the tests in finding bugs and defects.
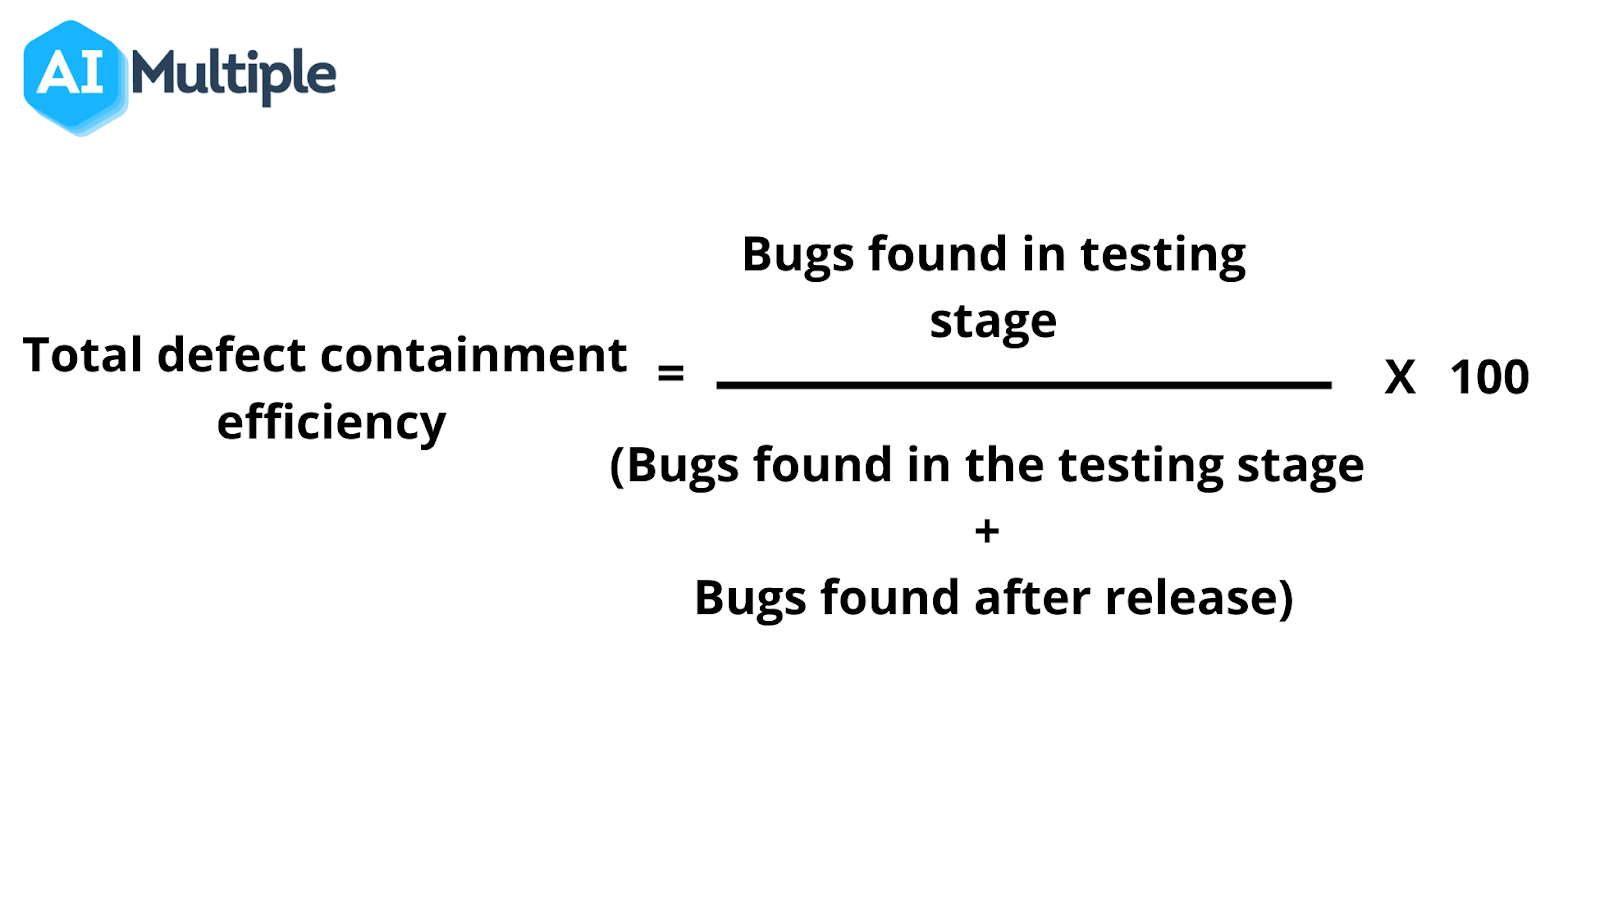
4-Total defect containment efficiency:
This ratio indicates how effective your testing process was in finding defects. A high ratio is desired, and a low ratio means that the testing process needs improvement. Defects in the production stage are costly, so this is a last-resort ratio. ( see Figure 4)
Figure 4
Test coverage
Test coverage metrics are designed to understand what portion of the total project/application has been tested. Coverage ratios do not provide information about the quality of the tests. They can be used to understand if the team is behind, on, or ahead of the testing schedule.
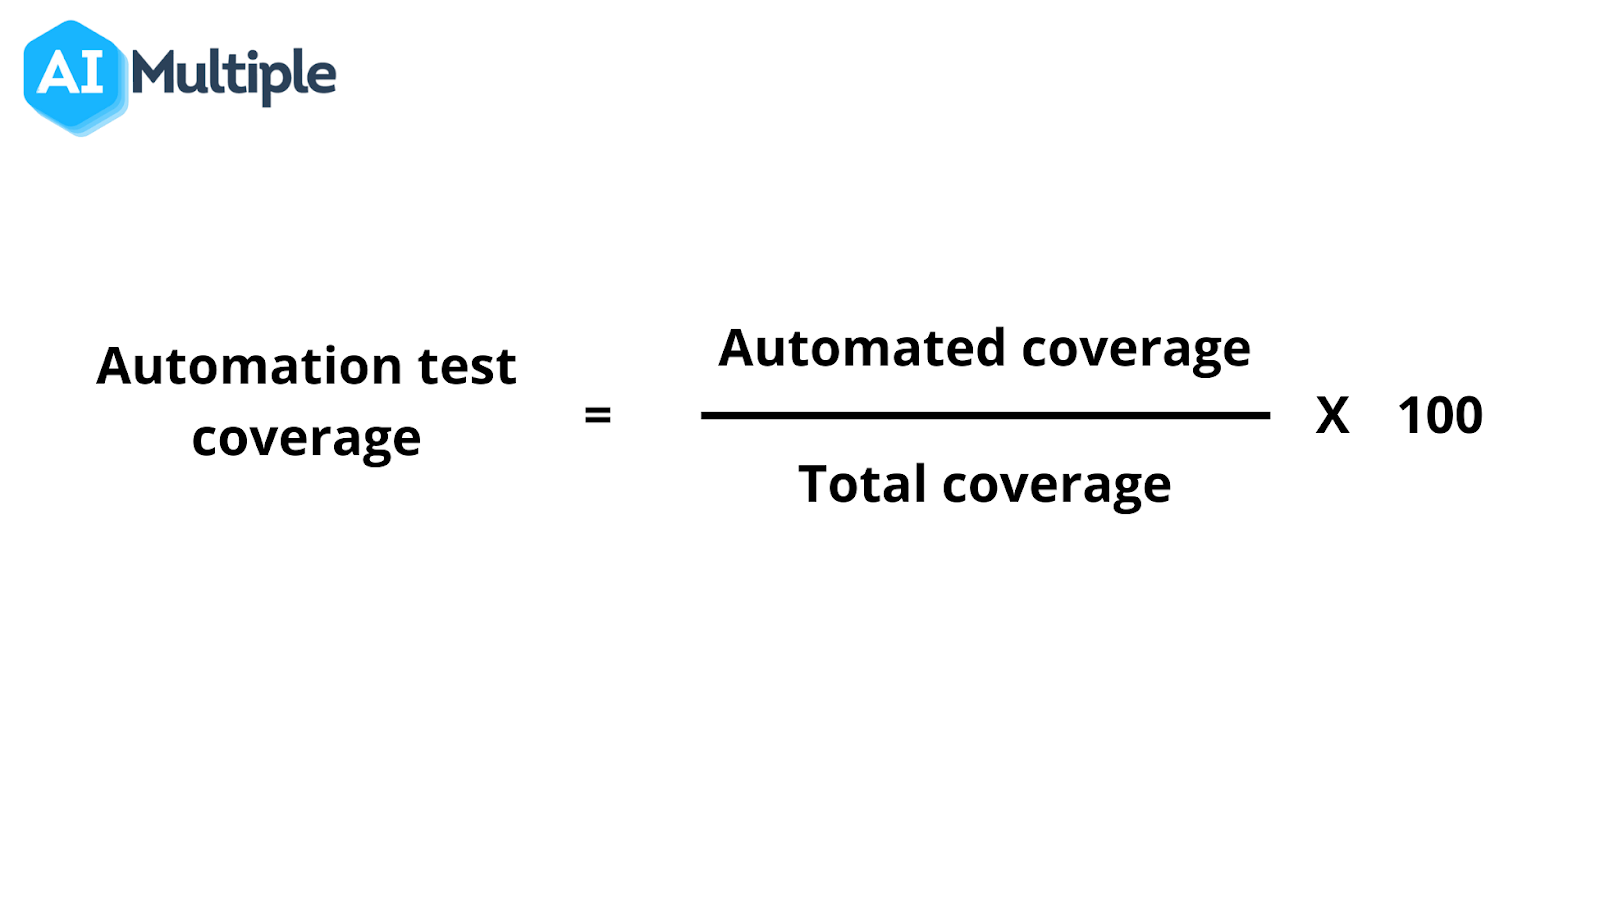
5- Automation test coverage
It tracks what portion of the total tests are automated. It can be used by executives to measure their automation plans and progress. ( see Figure 5)
Figure 5.
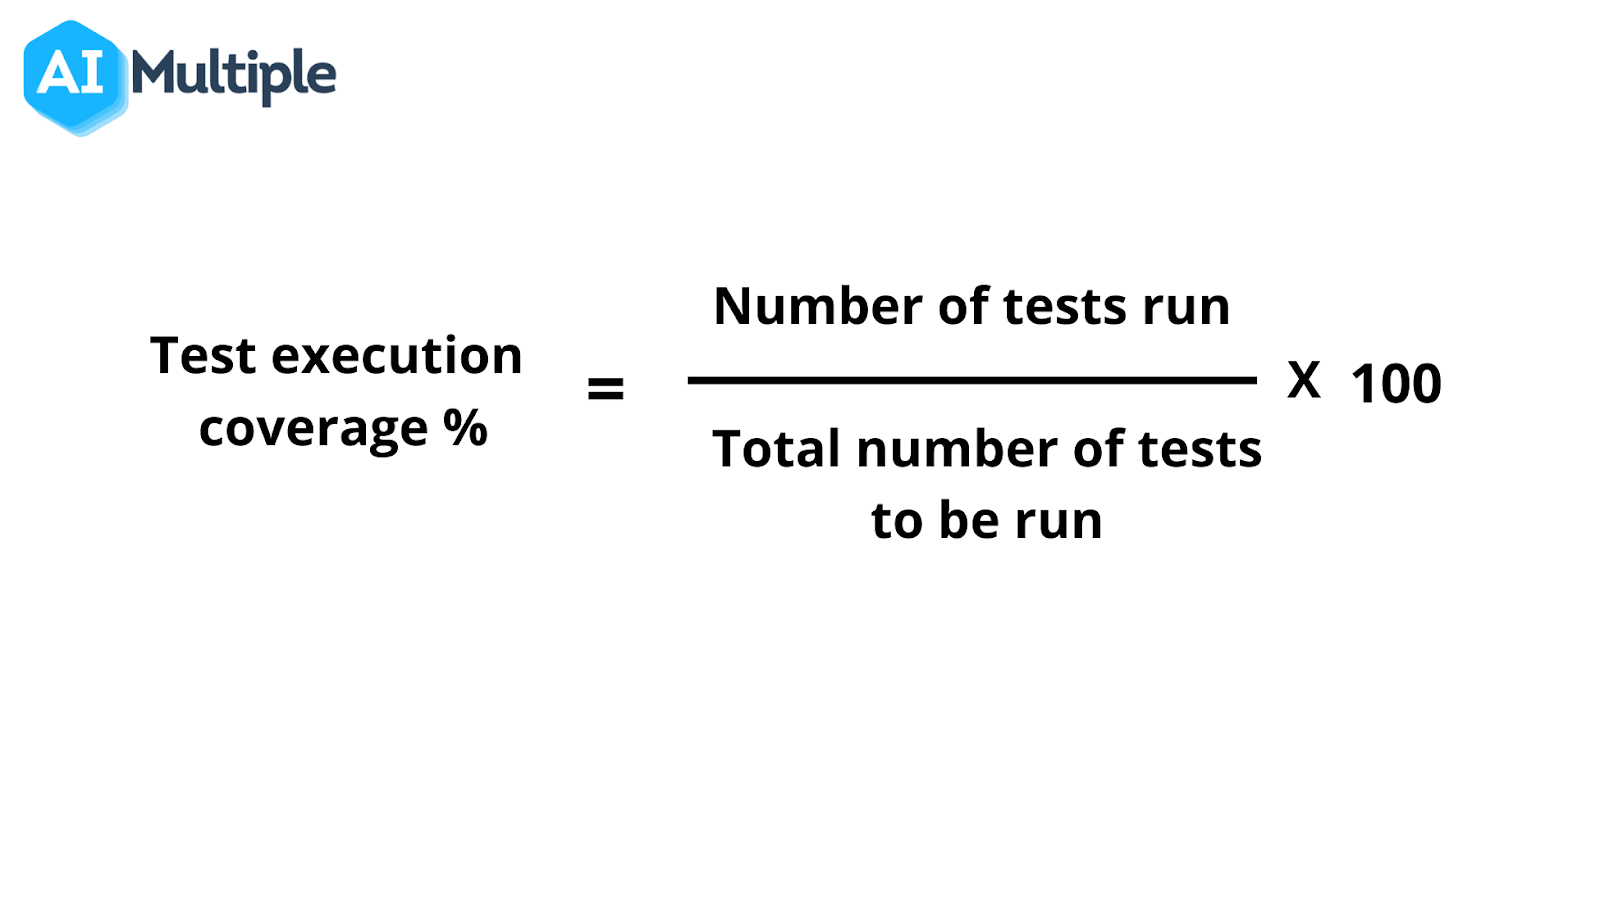
6- Test execution coverage:
How much of the required tests have been covered so far. ( see Figure 6)
Figure 6.
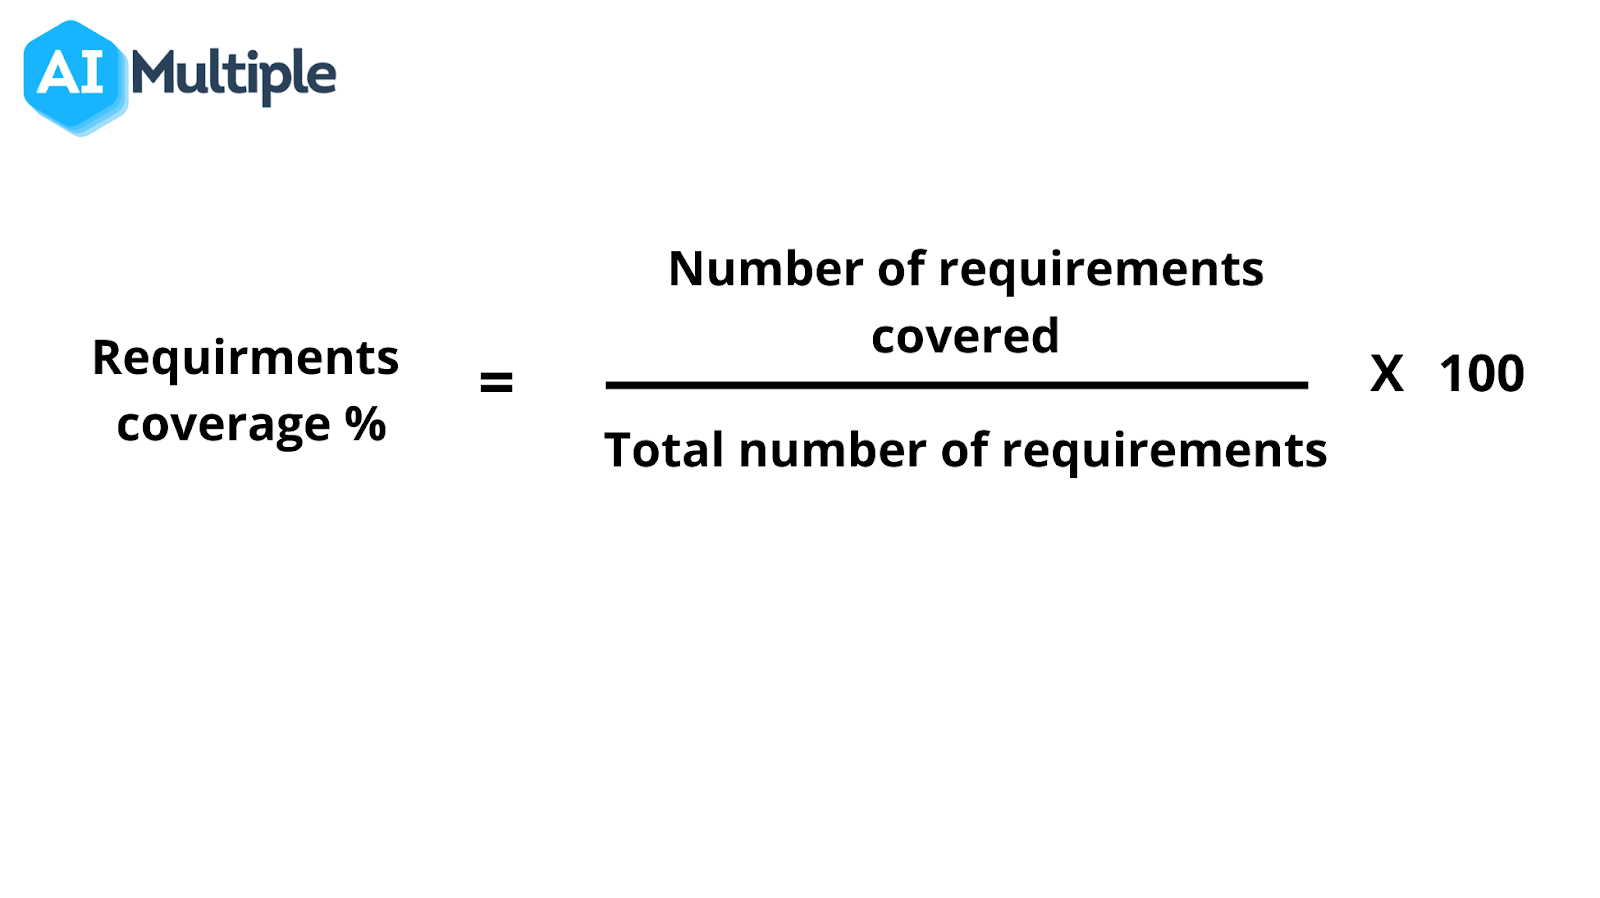
7- Requirement coverage
This ratio shows how much of the requirements have been covered. ( see Figure 7)
Figure 7.
Defect metrics
Defect metrics deal with defects in different ways as they are categorizable in different ways, such as severity, type, root cause, etc.
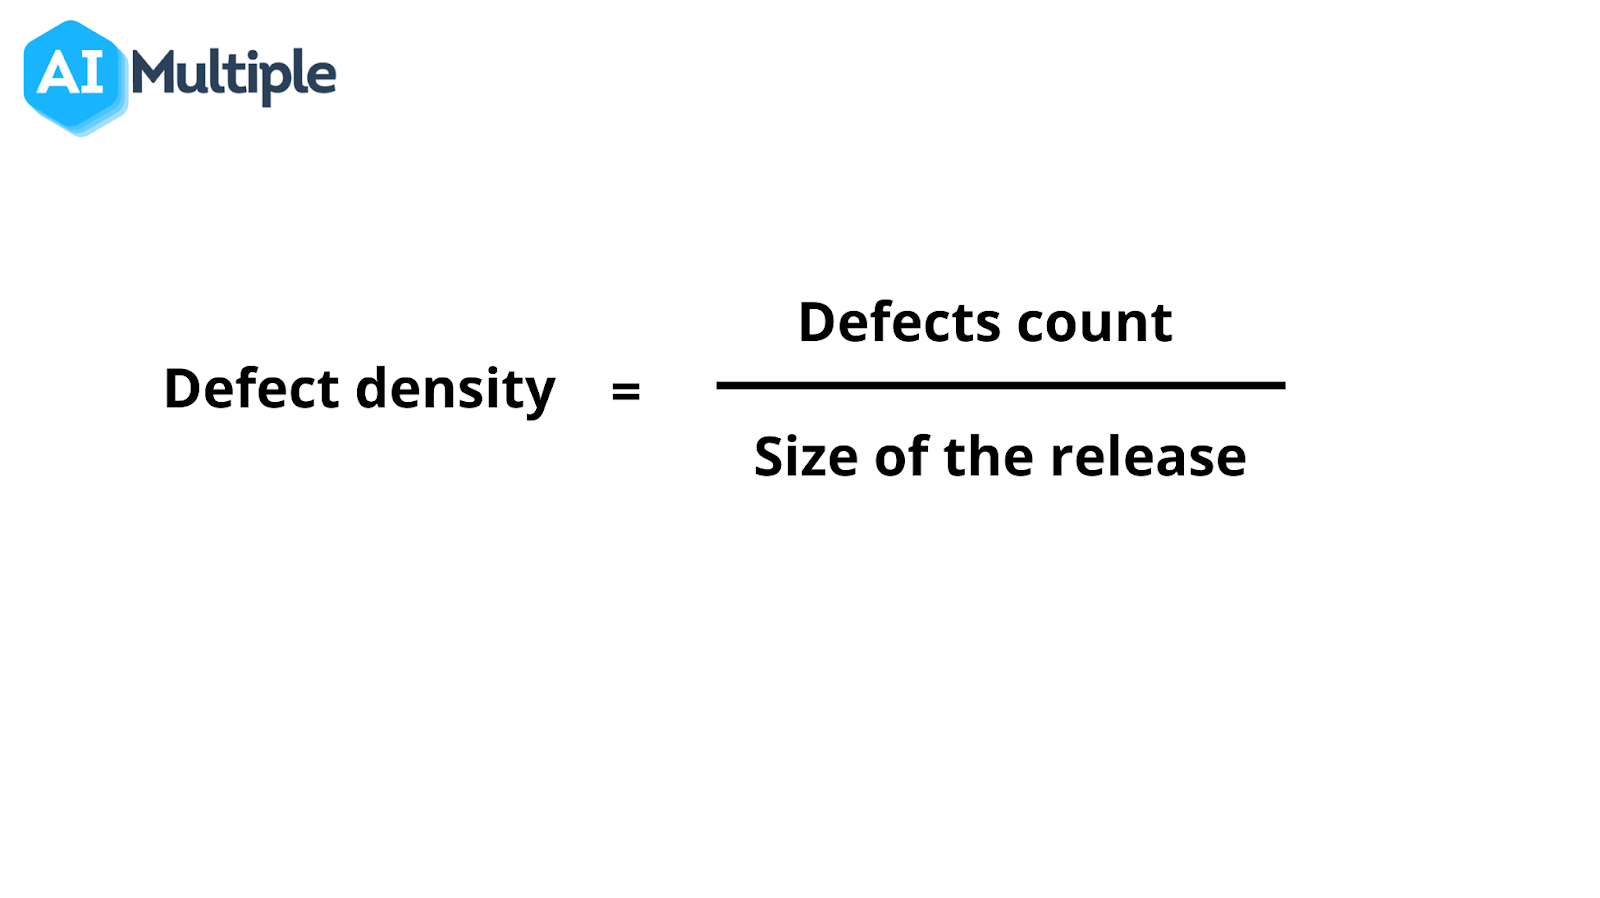
8- Defect density
This measure tracks the total number of defects over the size of the release. This ratio indicates whether the build is ready for release or requires further testing. A good defect density ratio is considered 1 defect per 1000 lines of code. ( see Figure 8)
- Consider the complexity of the code.
- Developer’s level of skills. A highly skilled developer team might have optimized the code, so there are fewer lines of code; in this case, the defect density ratio might be high. A lower-skilled developer team might have written many lines of redundant codes; in this case, defect density can stay constant or go down.
Figure 8.
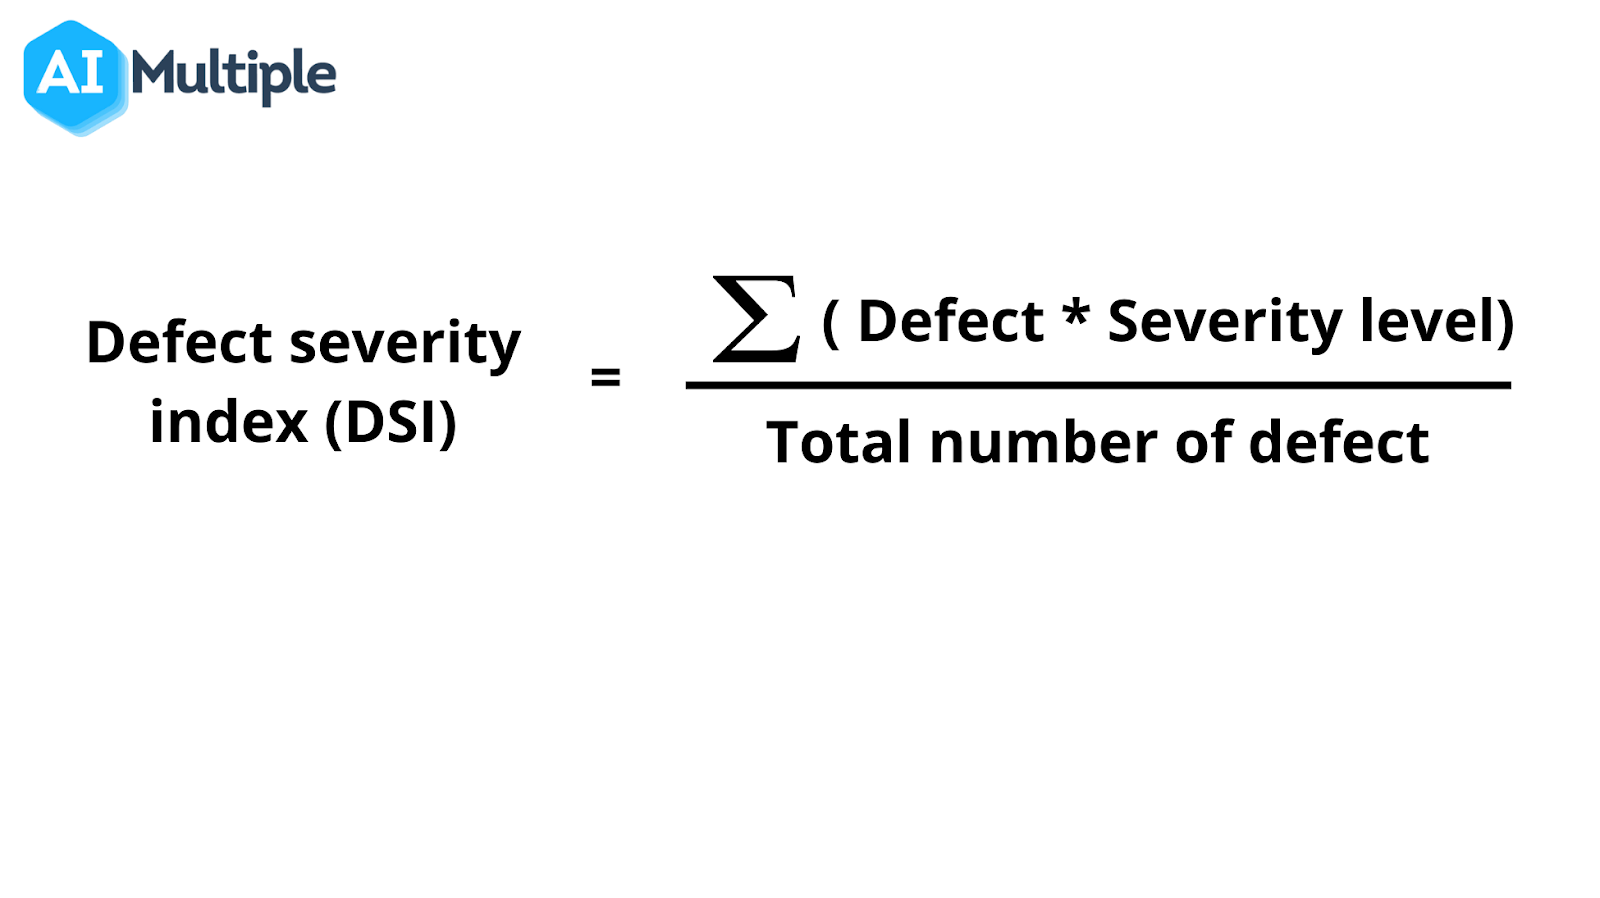
9- Defect severity index
It measures product quality. The QA team can use this metric to understand the effect of negative impacts on software quality and performance. ( see Figure 9)
Figure 9
Further reading
- API Testing: 3 Benefits & 8 Different Types
- Automation Testing Tools: Code-based, Robotics & AI tools
- Integration Testing: Importance, Types & Challenges
- Autonomous Testing: Top 5 Benefits, Use Cases & Challenges
To get the latest guides on automation testing, download our whitepaper:

Cem has been the principal analyst at AIMultiple since 2017. AIMultiple informs hundreds of thousands of businesses (as per similarWeb) including 60% of Fortune 500 every month.
Cem's work has been cited by leading global publications including Business Insider, Forbes, Washington Post, global firms like Deloitte, HPE, NGOs like World Economic Forum and supranational organizations like European Commission. You can see more reputable companies and media that referenced AIMultiple.
Throughout his career, Cem served as a tech consultant, tech buyer and tech entrepreneur. He advised businesses on their enterprise software, automation, cloud, AI / ML and other technology related decisions at McKinsey & Company and Altman Solon for more than a decade. He also published a McKinsey report on digitalization.
He led technology strategy and procurement of a telco while reporting to the CEO. He has also led commercial growth of deep tech company Hypatos that reached a 7 digit annual recurring revenue and a 9 digit valuation from 0 within 2 years. Cem's work in Hypatos was covered by leading technology publications like TechCrunch and Business Insider.
Cem regularly speaks at international technology conferences. He graduated from Bogazici University as a computer engineer and holds an MBA from Columbia Business School.
To stay up-to-date on B2B tech & accelerate your enterprise:
Follow on
Comments
Your email address will not be published. All fields are required.